Litecoin Plunges to $47 Low as Bears Threaten Further Downtrend

Litecoin (LTC) price analysis, October 26, 2020. Despite its promising upside momentum, Litecoin has plunged to a $47 low. There are indications that the current fall will extend to another low at $44.
Litecoin Price Long-Term Prediction: Bearish
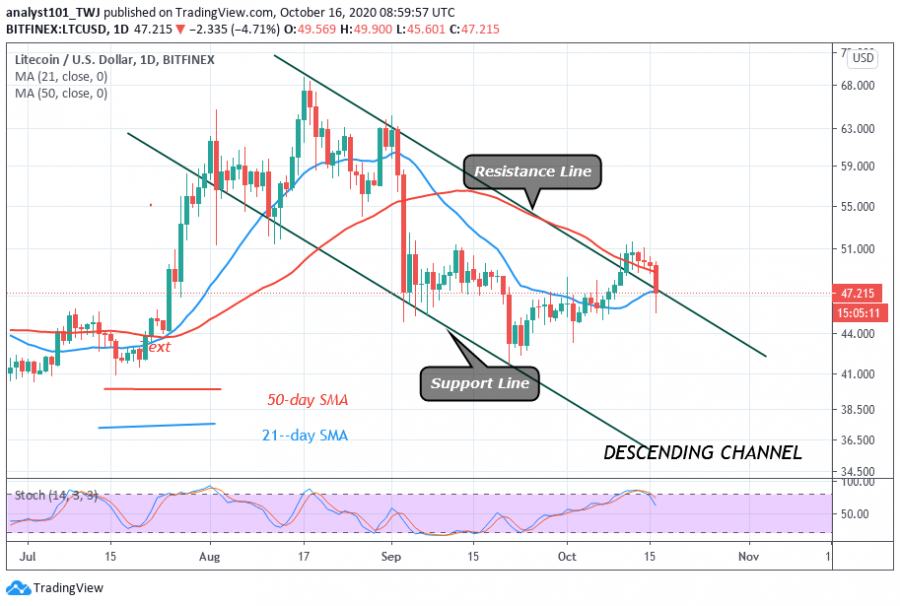
The current breakdown is a bearish reaction as bulls fail to break the $51 resistance. Buyers made concerted efforts to push LTC above the $51 resistance but to no avail.
On three occasions, the bulls were repelled at the $51 resistance. On each attempt at the resistance, the market will drop to a $49 low. Today, LTC encountered a breakdown as price tests the $49.80 high. However, the selling pressure will resume if the price breaks below the SMAs.
Nonetheless, if price rebounds at the current support, the coin will fall back into the range-bound zone of $49 and $51. Today, LTC is trading at $47.37 at the time of writing. Currently, the price is fluctuating above the current support.
Litecoin Indicator Analysis
The recent breakdown has caused LTC to trade in the bearish trend zone. A break below the SMAs means a further decline of the coin. The crypto is currently below the 80% range of the daily stochastic. It indicates that Litecoin is in bearish momentum. Also, a further downward movement of the coin is expected.

Key Resistance levels: $80, $100, $120
Key Support levels: $50, $40, $20
What Is the Next Move for Litecoin?
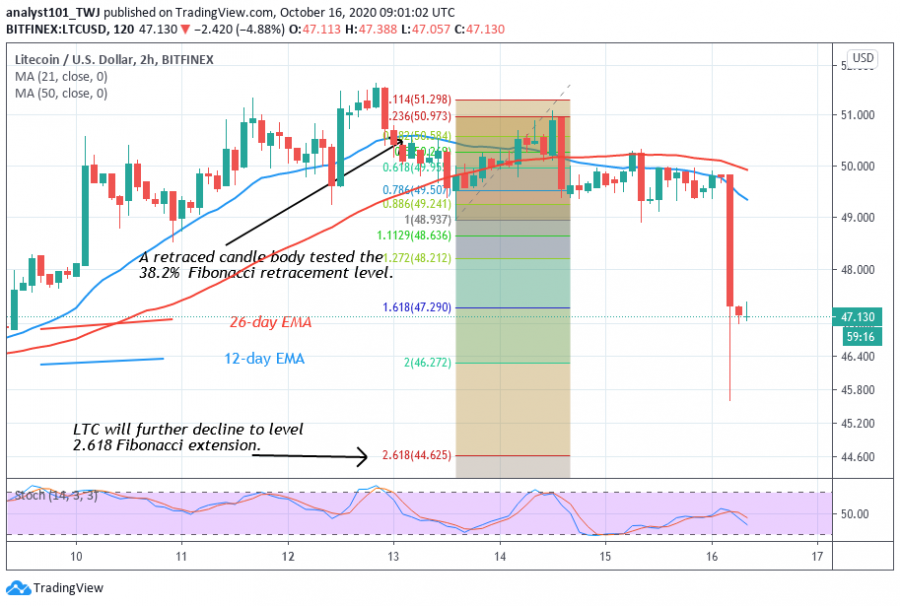
Currently, LTC is fluctuating above the $47 support. From the price action, the selling pressure is likely to continue. On the downtrend of October 13, the last retraced candle body tested the 38.2% Fibonacci retracement level. This implies that the market will fall to a level 2.618 Fibonacci extension. That is the low of $44.62.

Disclaimer. This analysis and forecast are the personal opinions of the author and not a recommendation to buy or sell cryptocurrency and should not be viewed as an endorsement by CoinIdol. Readers should do their own research before investing funds.
Price
Price
Price
News
Price

(0 comments)