Litecoin Is In a New Downtrend as Bears Resume Selling Pressure Falls Below $143

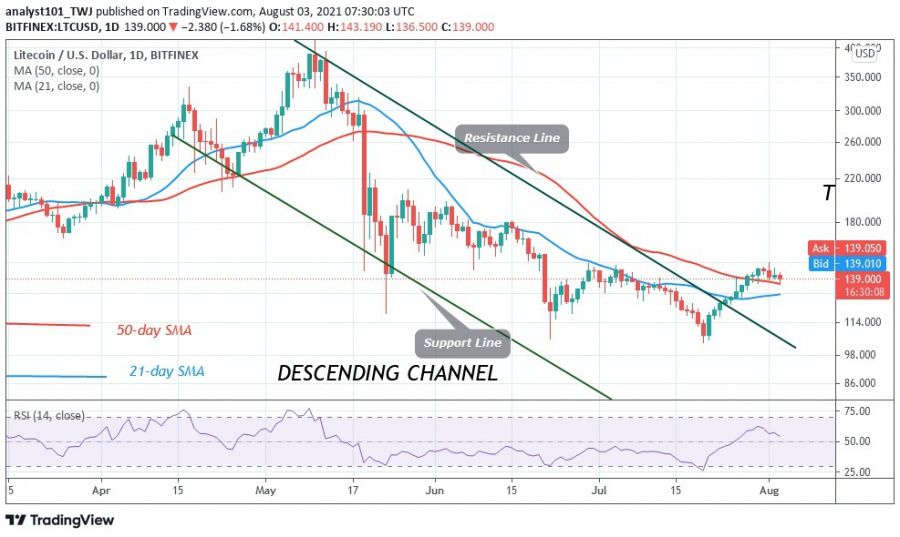
As of August 3, 2021 Litecoin (LTC) is trading at $138.28. Litecoin will likely continue to rise if the price bars remain above the moving averages.
Litecoin Price Long-Term Prediction: Bearish
On August 1, Litecoin (LTC) rose to $149.62 after breaking through resistance at $146. The upward momentum could not be sustained above the recent high as the cryptocurrency price fell below the $146 support. LTC price drops to $138.15, but then rallies. The upside move was rejected at the $146 high, which put the altcoin under selling pressure again. If the selling pressure continues, Litecoin is likely to fall to the lows of $126 or $119.
On the daily chart, LTC price is above the 50-day line SMA. The cryptocurrency will continue its uptrend if the 50-day line SMA holds. A break below the moving averages would mean the resumption of the downtrend.
Litecoin Indicator Analysis
Litecoin will continue to rise if the price bars stay above the moving averages. Litecoin is at level 53 on the Relative Strength Index for period 14, indicating that the cryptocurrency is in the bullish trend zone above the 50 midline. The 21-day and 50-day SMAs are sloping downward, indicating a downtrend.

Technical Indicators:
Major Resistance Levels - $500 and $540
Major Support Levels - $120 and $80
What Is the Next Move for Litecoin?
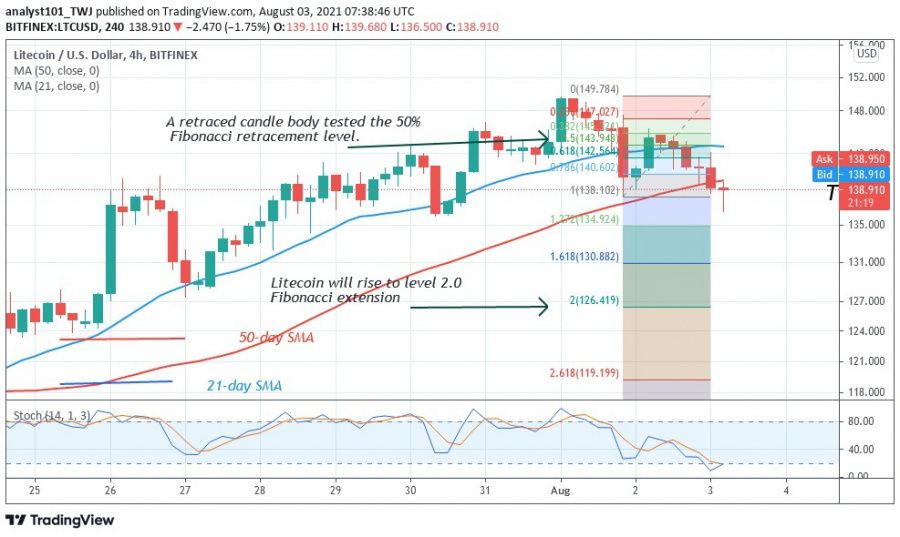
On the 4-hour chart, Litecoin is in a downtrend as the price is above the moving averages. Meanwhile, on the August 1 downtrend; a retraced candle body tested the 50% Fibonacci retracement level. This retracement suggests that the market will fall to the 2.0 Fibonacci extension level or $126.41.

Disclaimer. This analysis and forecast are the personal opinions of the author are not a recommendation to buy or sell cryptocurrency and should not be viewed as an endorsement by CoinIdol. Readers should do their own research before investing funds.
Price
News
Price
Price
Price

(0 comments)