Litecoin Hovers above $80 as Buyers Recoup to Resume Uptrend

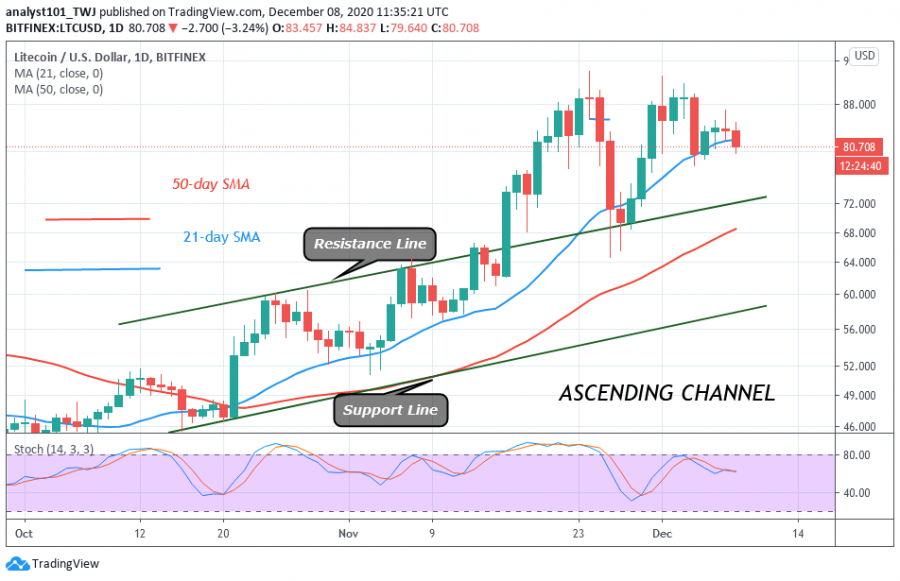
Yesterday, Litecoin traded and reached a high of $87 but failed to break the $90 overhead resistance. Within 24 hours the coin also slumped to $80 low.
This has been the bearish scenario since November 23 when Litecoin reached a high of $90. At the $90 overhead resistance, buyers could not penetrate the resistance after three unsuccessful attempts. The crypto will fall each time the resistance is tested. Today, Litecoin has fallen to the $80 support and it is most likely to move up. On December 4, the crypto moved up after testing the $80 support. Nonetheless, if the $80 support fails to hold the coin will decline to $65 low.
Litecoin indicator analysis
Litecoin is below the 30% range of the daily stochastic. This indicates that the coin has bearish momentum. The price has broken below the 21-day SMA and is approaching the 50-day SMA. A break below the SMAs will compel the coin to decline.

Key Resistance levels: $80, $100, $120
Key Support levels: $50, $40, $20
What is the next move for Litecoin?
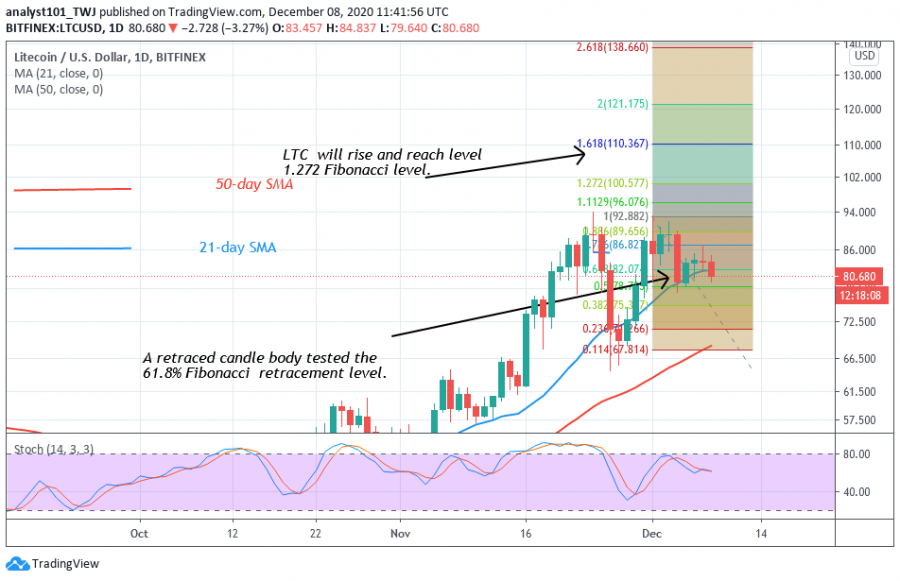
The crypto has had two uptrends as it retested the $90 overhead resisted. The Fibonacci tool has indicated an upward movement of the coin. On December 4, a retraced candle body tested the 61.8%Fibonacci retracement level. The retracement indicates that the crypto will reach level 1.618 Fibonacci extensions or the high of $110.36

Disclaimer. This analysis and forecast are the personal opinions of the author that are not a recommendation to buy or sell cryptocurrency and should not be viewed as an endorsement by CoinIdol. Readers should do their own research before investing funds.
Price
PR
Business
Price
Price

(0 comments)