Litecoin Remains Stuck At $65 And Faces Further Price Decline
Updated: Sep 16, 2023 at 12:03

Cryptocurrency analysts of Coinidol.com report, Litecoin (LTC) price is moving sideways above $61 support.
Long-term forecast of the Litecoin price: fluctuation range
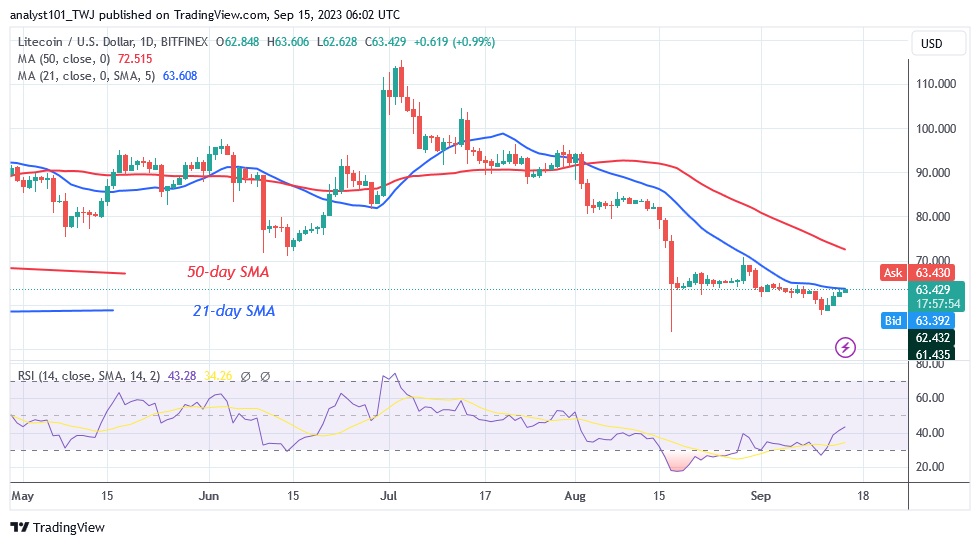
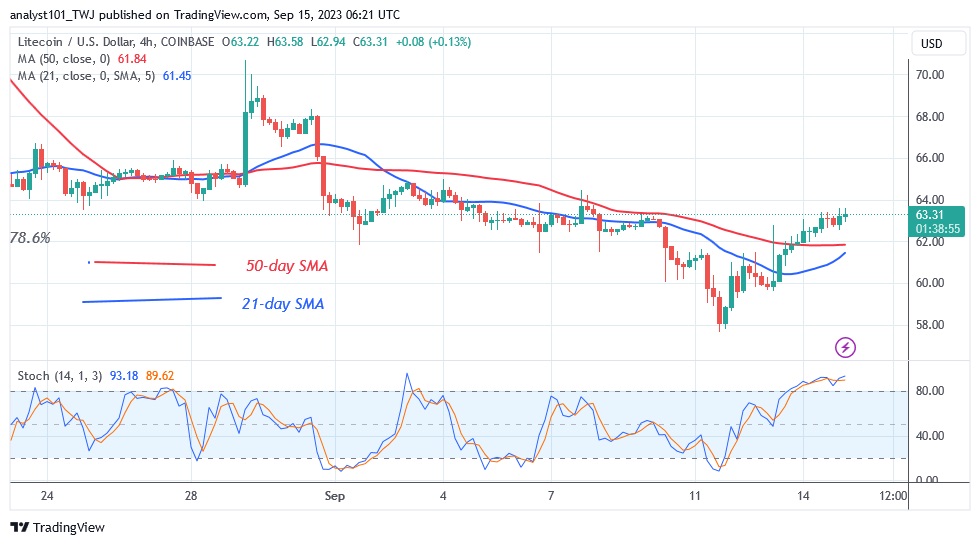
The 21-day line SMA or the barrier at $64 has been holding up the higher moves. At the time of writing, the cryptocurrency's price is at $63. Recently, the doji candlesticks have slowed down the price movement. The price of the altcoin fluctuates only slightly between $61 and $65. If Litecoin comes under selling pressure or additional limits are placed on the upward movement, the cryptocurrency will fall. For example, the altcoin will fall to its previous low of $53 if the bears break the current support. The altcoin is already overbought, so a higher move is unlikely.
Litecoin indicator analysis
After the upward correction, the Relative Strength Index of period 14 has risen to the value of 43. LTC is still in a downtrend zone. The price bar is currently facing or retesting the 21-day line SMA, which will lead to a downward price slump. Litecoin is gaining momentum above the stochastic threshold of 89 on the daily basis. The LTC price is overbought and could soon come under selling pressure.

Technical Indicators
Resistance levels: $100, $120, $140
Support levels: $60, $40, $20
What is the next move for Litecoin?
The price decline on August 17 has put Litecoin in a fluctuation range. The price is moving within a range and gradually approaching the previous low of $53. The downtrend could intensify if the cryptocurrency is rejected at the 21-day SMMA.

As we reported on September 08, the 21-day line SMA has slowed down the uptrend. Since the beginning of the decline, the 21-day line SMA has served as a resistance line.
Disclaimer. This analysis and forecast are the personal opinions of the author and are not a recommendation to buy or sell cryptocurrency and should not be viewed as an endorsement by CoinIdol.com. Readers should do their research before investing in funds.
Price
Price
Price
Price
News

(0 comments)