Litecoin Price Recovers, But Challenges Resistance At $110

The price of Litecoin (LTC) has fallen above the moving average after a rejection at $110. Price analysis by Coinidol.com.
Long-term forecast for the Litecoin price: bullish
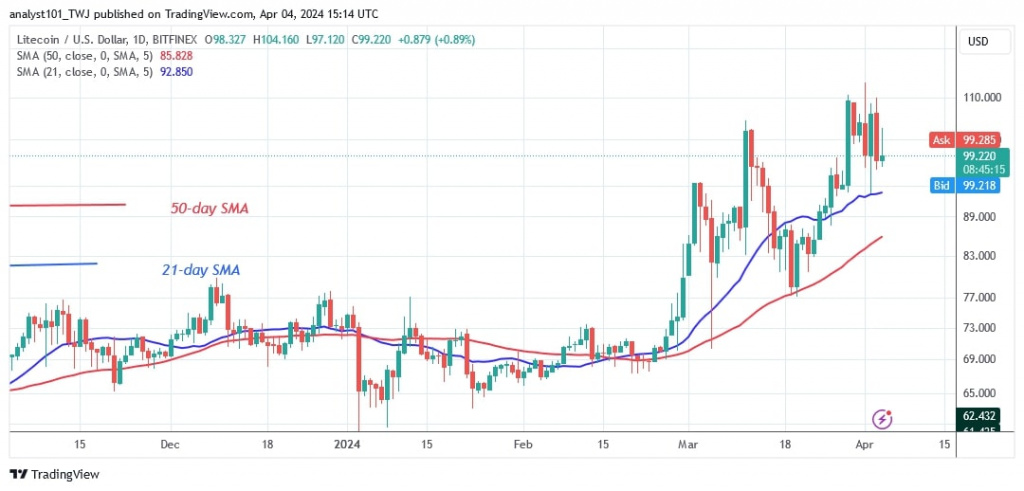
The cryptocurrency is showing a pattern of higher highs and higher lows. On the positive side, the altcoin will resume its uptrend when it pulls back above the moving average lines. The LTC price will rise and retest the resistance at $110.
A break above the $110 resistance will catapult the altcoin to another high of $144. If the price falls below the 21-day SMA, Litecoin will return to its previous low of $77. In the meantime, Litecoin is trading at 97.76 dollars.
Litecoin indicator analysis
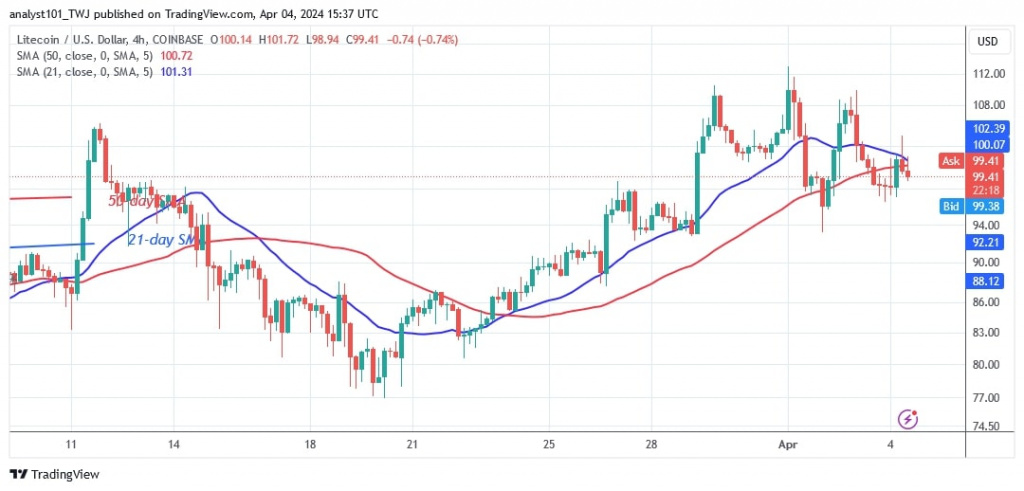
After the recent dip, the LTC price has pulled back above the moving average lines. This indicates that the cryptocurrency is continuing its upward trend. However, the price bars on the 4-hour chart are below the moving average lines, indicating the current trend.
Technical indicators
Resistance levels: $100, $120, $140
Support levels: $60, $40, $20

What's next for Litecoin?
Litecoin is bearish above its moving average lines. The upward correction continues as the price retraces above the moving average lines. Doji candlesticks have appeared on the 4-hour chart, slowing down the price action. The extended candle tails indicate strong buying above the current support.

Disclaimer. This analysis and forecast are the personal opinions of the author and are not a recommendation to buy or sell cryptocurrency and should not be viewed as an endorsement by CoinIdol.com. Readers should do their research before investing in funds.
Price
Price
News
Price
Price

(0 comments)