Litecoin Reaches Overbought Region, May Reverse at $143

The Litecoin price (LTC) is trading in the uptrend zone while facing rejection at the $130 resistance level.
Long-term forecast for the Litecoin price: Bullish
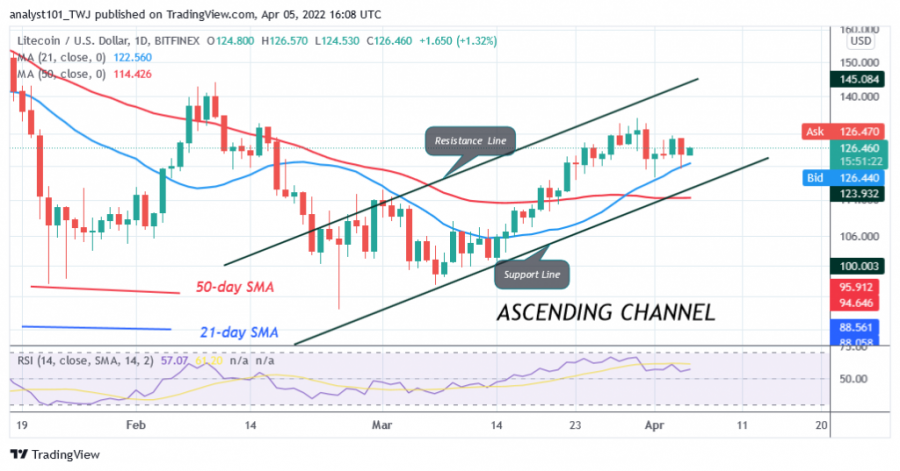
Since March 31, the uptrend has been broken at the $130 resistance level. The LTC price fell above the $120 support or moving averages and continued its sideways movement. This means that Litecoin will tend to rise above the moving averages to retest the resistance at $130 and $140.
In the last five days, buyers have not yet managed to break through these resistances. The LTC price will rally above the $140 high if the current resistance levels are broken. Moreover, the cryptocurrency will suffer a setback at the recent high as the market reaches the overbought zone. On the downside, the bears will try to break the support at $120 if the bulls fail to break the recent high. LTC price will fall to $101 if the altcoin loses the $120 support. Today, LTC/USD is trading at $126 at the time of writing.
Litecoin Indicators Analysis
Litecoin has fallen to level 56 on the Relative Strength Index for the period 14. The altcoin is still in the bullish trend zone and is capable of further upward movement. The price bars are above the moving averages, which will drive the altcoin higher. Litecoin is below the 50% area of the daily stochastic. This indicates that the market is in a bearish momentum, but the selling pressure has eased.
Technical indicators
Resistance levels: $240, $280, $320
Support levels: $200, $160, $120

What is the next move for Litecoin?
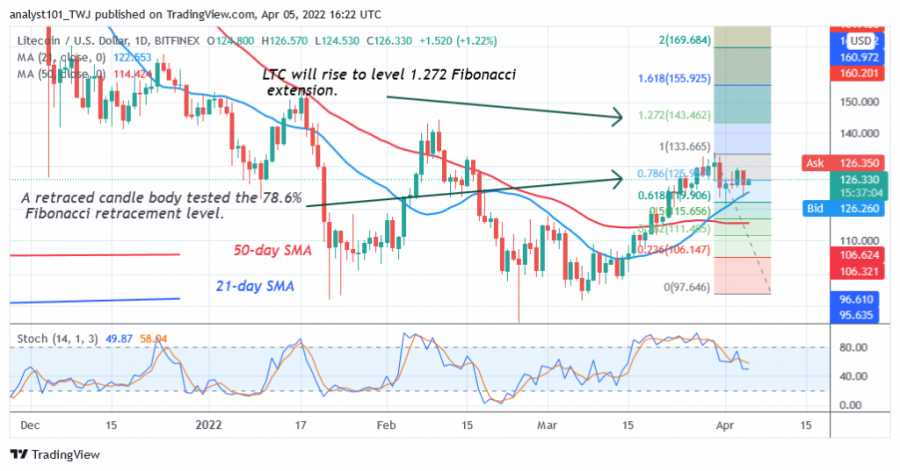
On the 4-hour chart, Litecoin is in an uptrend but has resumed a sideways movement below the resistance level. There is a probability of further upward movement of the cryptocurrency. Meanwhile, a retracement candlestick tested the 78.6% Fibonacci retracement level on March 30. The retracement suggests that LTC will rise, but will rebound at the 1.272 Fibonacci extension level or at $143.46.

Disclaimer. This analysis and forecast are the personal opinions of the author and are not a recommendation to buy or sell cryptocurrency and should not be viewed as an endorsement by CoinIdol. Readers should do their own research before investing funds.
Price
Price
News
Coin expert
Price

(0 comments)