Litecoin Faces Rejection At $53 As It Could Drop To Low Of $49
Updated: Oct 12, 2022 at 12:28

The price of Litecoin (LTC) is in a downtrend as it drops below the 21-day line SMA.
Long-term forecast of Litecoin price: bearish
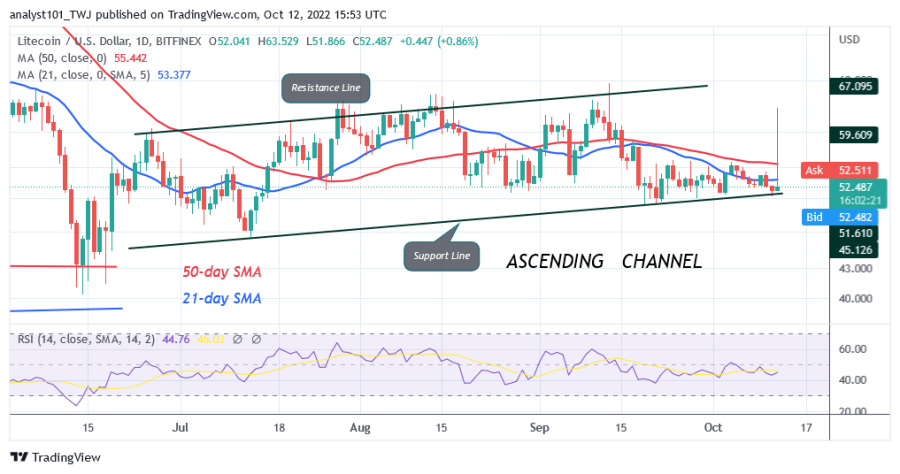
The cryptocurrency is trading at $52.72 at the time of writing. The altcoin will fall back to the previous low when it encounters rejection at the recent high. Today, there is a price spike as it rallies to the high of $63.52. However, immediately after the rally, the LTC price drops sharply.
Since the price collapse on September 21, the cryptocurrency has been trading above the $50 support level. In the last three weeks, the Litecoin price has been moving in a range between $50 and $56. The uptrend will resume if the resistance at $56 is overcome. Likewise, the altcoin will continue to decline if the $50 support is breached.
Litecoin indicators analysis
The RSI has remained stable above the 40 level as the cryptocurrency continues its sideways movement. However, the LTC price is capable of falling further in the downtrend zone. The altcoin could fall as the price bars are below the moving average lines. Meanwhile, Litecoin is in a bullish momentum above the 30 area of the daily stochastic.

Technical Indicators:
Key resistance levels - $200 and $250
Key support levels - $100 and $50
What is the next move for Litecoin?
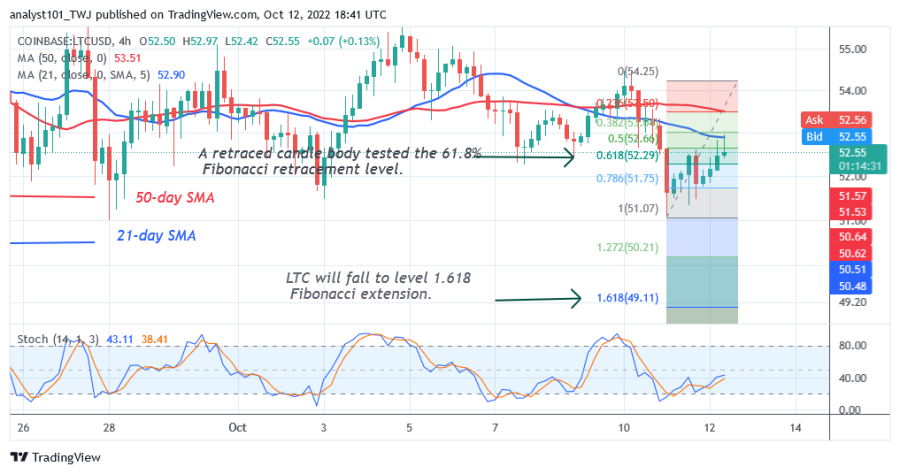
Litecoin is correcting higher, but may face rejection at the 21-day line SMA. On October 11, LTC price corrected up and a candlestick tested the 61.8% Fibonacci retracement level. The correction suggests that the LTC price will fall to the Fibonacci extension level of 1.618 or to $49.11.

Disclaimer. This analysis and forecast are the personal opinions of the author and are not a recommendation to buy or sell cryptocurrency and should not be viewed as an endorsement by CoinIdol. Readers should do their own research before investing in funds.
Price
Price
Price
Price
News

(0 comments)