Litecoin in Minor Retracement, Eyes Next Target at $604 High

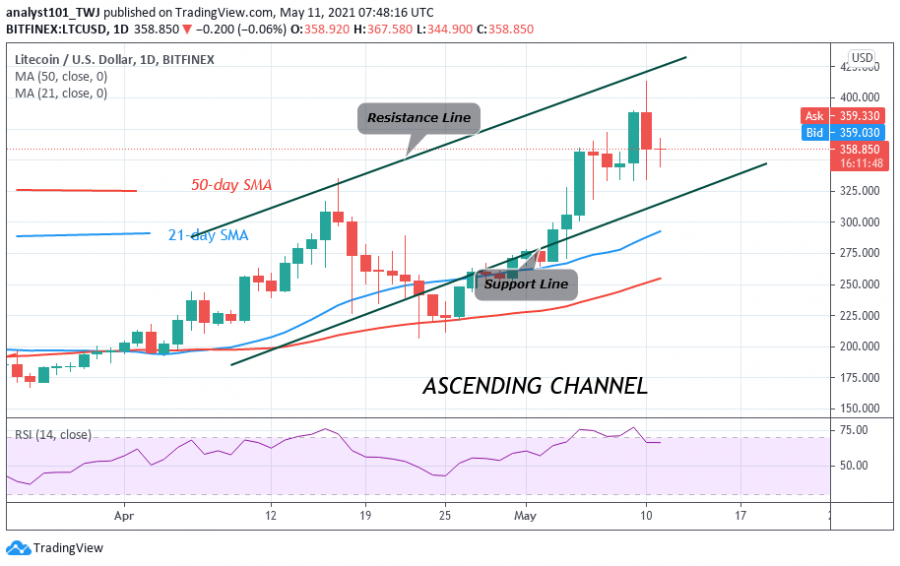
Yesterday, LTC/USD rallied to a high of $413 and was rejected at the $420 resistance zone. The LTC price fell to the support at $340 and resumed an upward move on the upside.
Similarly, on May 10, a candlestick possesses a long tail. This candlestick represents that there is a strong buying pressure above the $340 support level. And it points to the fact the altcoin is likely to resume upward after a minor retracement.
If LTC price resumes a fresh uptrend, a retest at the $420 resistance zone is likely. A breakout at the $420 resistance will increase the chances of having the next target price at $604. However, if LTC/USD turns down and the bears break the $340 support, Litecoin will decline to the previous low at $240. In the meantime, Litecoin is trading at $361.42 at the time of writing.
Litecoin indicator analysis
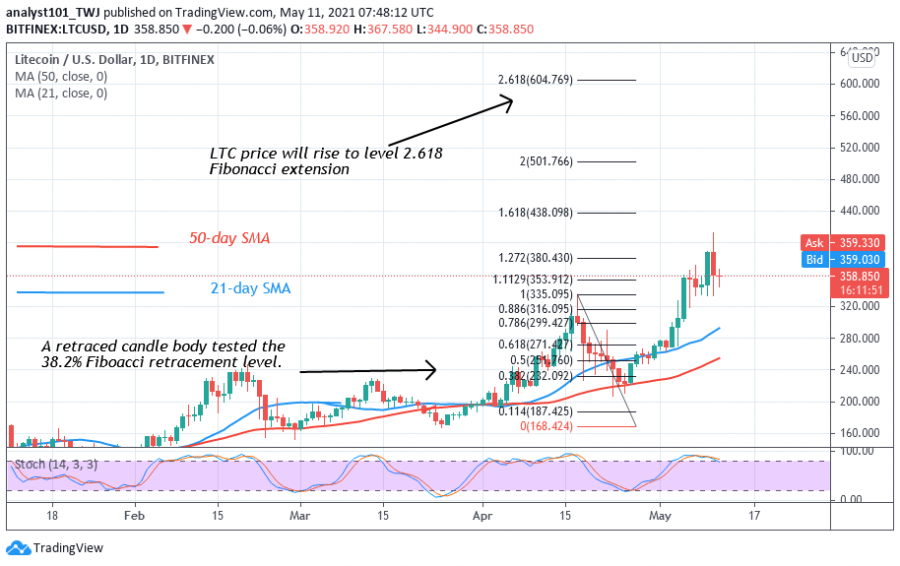
Litecoin is above the 80% range of the daily stochastic. The stochastic bands are sloping downward indicating the downtrend. The altcoin is at level 43 of the Relative Strength Index period 14. LTC price is in the downtrend zone and capable of falling on the downtrend zone.

Technical indicators:
Major Resistance Levels – $500 and $540
Major Support Levels – $340 and $40
What is the next move for Litecoin?
Litecoin is expected to resume an upward move after a minor retracement. The current downward move is expected to terminate at the $340 support. Meanwhile, on April 17 uptrend; a retraced candle body tested the 38.2% Fibonacci retracement level. This retracement indicates that the market will rise to level 2.618 Fibonacci extensions or the high of $604.76.

Disclaimer. This analysis and forecast are the personal opinions of the author and not a recommendation to buy or sell cryptocurrency and should not be viewed as an endorsement by CoinIdol. Readers should do their own research before investing funds.
Price
Price
Price
Price
Price

(0 comments)