Litecoin Fluctuates Between $52 and $58 Price Levels as It May Decline

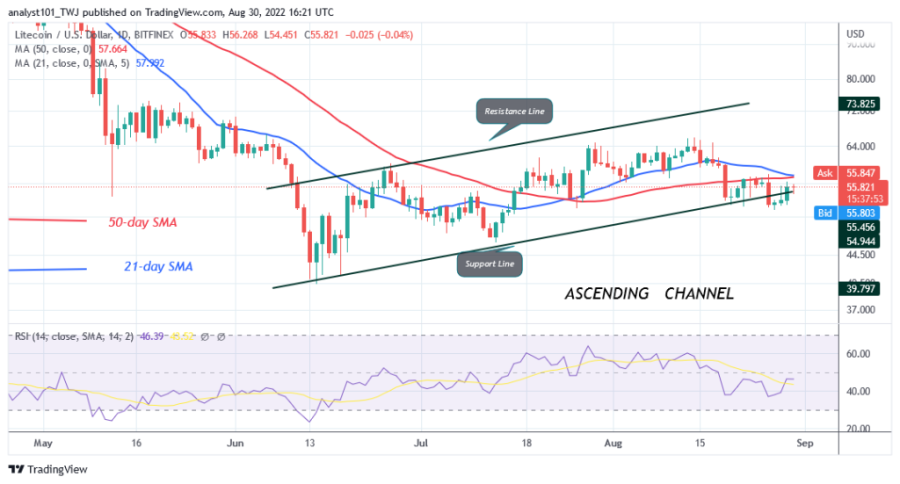
Litecoin (LTC) is in a downward trend and has fallen to the low of $52. Yesterday, the cryptocurrency made an upward movement as it approached the $58 resistance level.
Since August 26, the altcoin has been trading between $52 and $58. Should buyers push the price above the $58 high, Litecoin will regain upward momentum.
LTC price will rally above the moving average lines. LTC/USD will rise and retarget the overriding resistance at $64. Conversely, the downtrend will resume if the bears break below the $52 support. The market will then fall further to the lows of $44 and $49. At the time of writing, Litecoin is trading at $55.
Litecoin indicator analysis
Litecoin is at level 45 of the Relative Strength for the period 14. XRP price bars are below the moving average lines, indicating further downward movement. The cryptocurrency is above the 40% area of the daily stochastic. Litecoin is in a bullish momentum.

Technical indicators:
Major Resistance Levels - $200 and $250
Major Support Levels - $100 and $50
What is the next move for Litecoin?
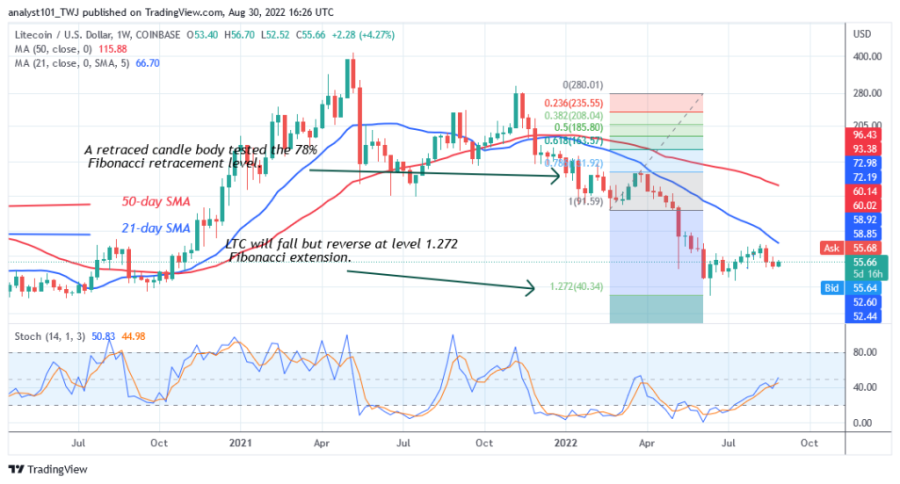
Litecoin is in an upward correction as the market has reached oversold territory. If LTC moves up from the recent high, the Fibonacci tool analysis will take hold. On the weekly chart, a candlestick has tested the 78.6% Fibonacci retracement level on March 21. The retracement suggests that the LTC price will fall, but reverse at the Fibonacci extension level of 1.272 or $0.40.

Disclaimer. This analysis and forecast are the personal opinions of the author and are not a recommendation to buy or sell cryptocurrency and should not be viewed as an endorsement by CoinIdol. Readers should do their own research before investing in funds.
Price
News
Price
Price
News

(0 comments)