Solana Is In A Trading Range But Threatens To Fall Below $220

Solana (SOL) price is rising as buyers try to keep it above the 21-day SMA and the $248 level.
SOL price long term forecast: bearish
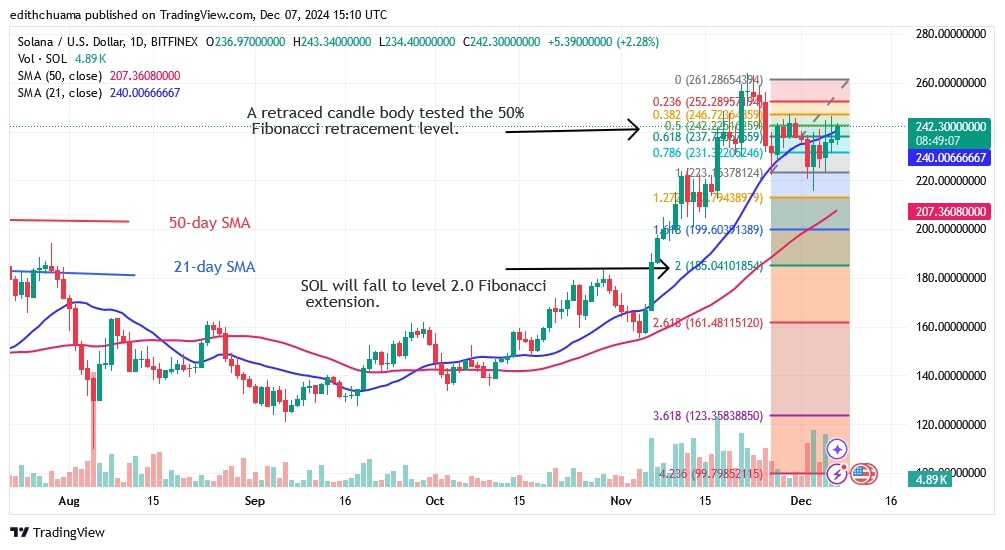
Since November 27, Solana has failed to rally above the 21-day SMA and the $248 resistance level. The bears are persistent as the cryptocurrency continues to be rejected. If the bulls are successful, Solana will retest its high price of $260. Solana's current price range is between $220 and $248.
On the downside, if the altcoin is rejected and falls below the $220 support level, Fibonacci analysis will be applied. Solana will fall above the 50-day SMA or below the Fibonacci extension of level 2.0, which is at $185.04. SOL is currently worth $242.
Analysis of SOL price indicators
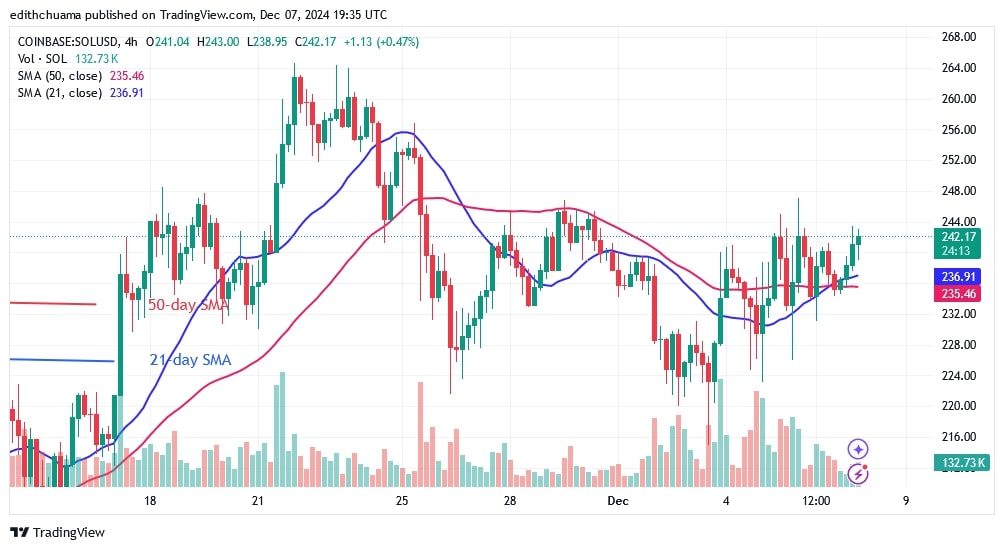
Solana is trapped between the moving averages, but buyers are trying to keep the price above the 21-day SMA. On the 4-hour chart, the price bars are above the moving average lines, but the upward trend is hindered by resistance at $248. The sideways trend has now caused the moving average lines to become horizontal.
Technical indicators
Major supply zones: $220, $240, $260
Major demand zones: $140, $120, $100

What is the next move for Solana?
Solana has been trading sideways on the 4-hour chart since November 26. The altcoin is trading above the $220 support and $248 resistance. The price bars are moving both below and above the moving average lines. If the rangebound levels are broken, the cryptocurrency will show a trend.

Disclaimer. This analysis and forecast are the personal opinions of the author, are not a recommendation to buy or sell cryptocurrency, and should not be viewed as an endorsement by CoinIdol.com. Readers should do their research before investing in funds.
Price
News
Price
Price
Price

(0 comments)