Chainlink Is In a Brief Uptrend, Faces Strong Selling Pressure at $35 High

Chainlink (LINK) price analysis April 11, 2021. LINK/USD has fallen to a $32 low as bulls failed to breach the $35 overhead resistance.
Chainlink (LINK) price Long-term Analysis: Ranging
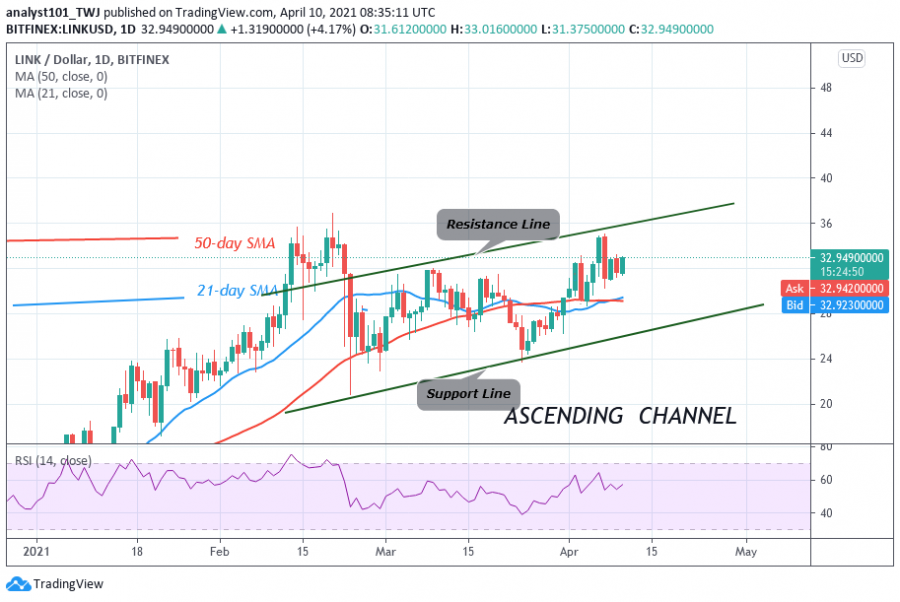
Since February 13, buyers have failed to push Chainlink above the overhead resistance. Each time the overhead resistance is retested the altcoin will fall and resume downward correction. For instance, on February 13 and 19, the bulls retested the overhead resistance which resulted in the formation of a bearish double top. This bearish pattern caused Chainlink to fall to a $24 low and resumed a prolonged downward correction.
On April 6, buyers again retested the $35 resistance but were resisted. The market fell to $30 low as price fluctuated below the resistance zone. On the upside, if buyers can break the $35 overhead resistance, LINK will rally above $40. However, if buyers fail to break the overhead resistance the downward correction will linger on.
Chainlink (LINK) Indicator Reading
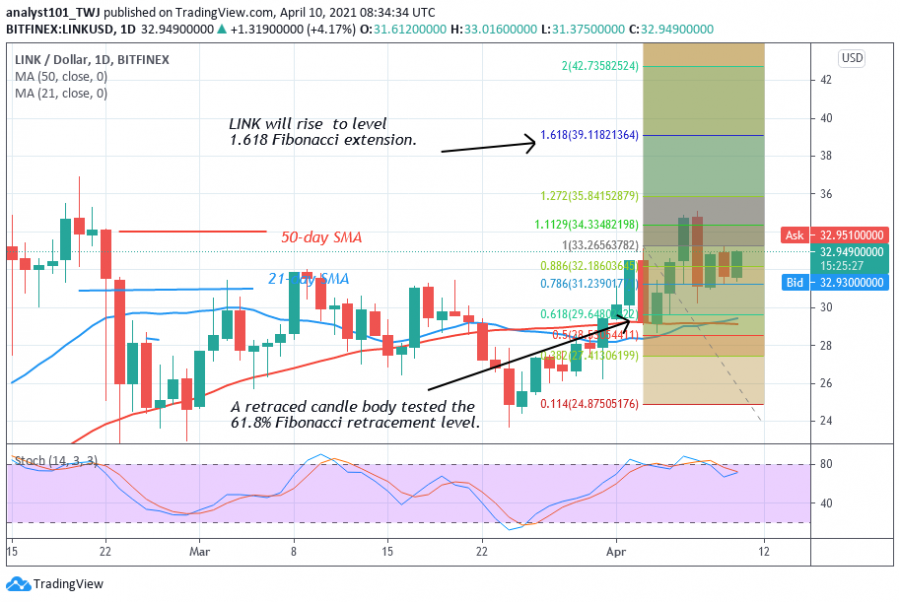
LINK price is above the 21-day and 50-day SMAs which suggests a possible rise in price. LINK is at level 57 of the Relative Strength Index period 14. It indicates that Chainlink is still in the uptrend zone and possibly resumes an upward move. Presently, LINK is above the 77% range of the daily stochastic. The market has bullish momentum.

Technical indicators:
Major Resistance Levels – $38 and $40
Major Support Levels – $22 and $20
What Is the Next Move for Chainlink (LINK)?
Chainlink is likely to rise if price remains above the moving averages at all times. The price indicator has shown an upward movement of price. In the uptrend of April 3, a retraced candle body tested the 61.8% Fibonacci retracement level. This retracement indicates that the market will rise to level 1.618 Fibonacci extensions or the high of $39.11. From the price action, the altcoin is still fluctuating below the overhead resistance.

Disclaimer. This analysis and forecast are the personal opinions of the author and not a recommendation to buy or sell cryptocurrency and should not be viewed as an endorsement by Coin Idol. Readers should do their own research before investing funds.
Coin expert
Price
Coin expert
Price
Coin expert

(0 comments)