Annual Forecast for Bitcoin Cash, 2022

The price of Bitcoin Cash (BCH) is in a downtrend. At press time, the cryptocurrency is trading at $376.
Bitcoin Cash Price Long-Term Analysis: Bearish
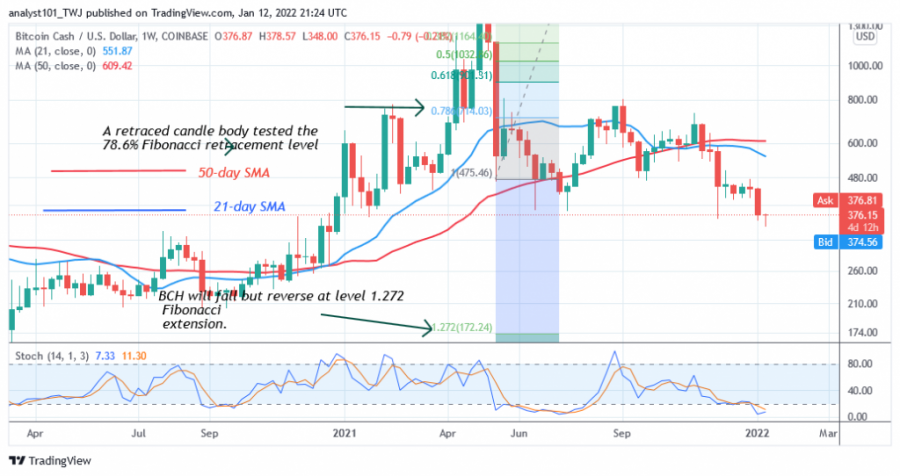
At its launch in 2017, BCH rose to a high of $4,300 but fell sharply soon after to a low of $104 in January 2019. Bitcoin Cash regained upward momentum in 2021 when it rose to a high of $1,216. Since May 2021, the bear market has started again as cryptocurrencies started a downward trend.
Today, Bitcoin Cash has fallen to the low of $376. The market has also reached the oversold zone. On the weekly chart, BCH, shows that the previous low above the $300 support is being retested. This current support has not been breached since January 2021. The uptrend will continue once the current support holds.
Bitcoin Cash indicator display
BCH is below the 20% area of the daily stochastic. This is an indication that the market has reached the oversold area. Selling pressure has reached bearish exhaustion. When buyers appear in the oversold region, prices will begin to move higher.
Technical Indicators
Key Resistance Zones: $800, $820, $840
Key Support Zones: $500, $480, $460

Bitcoin Cash medium term trend: bearish
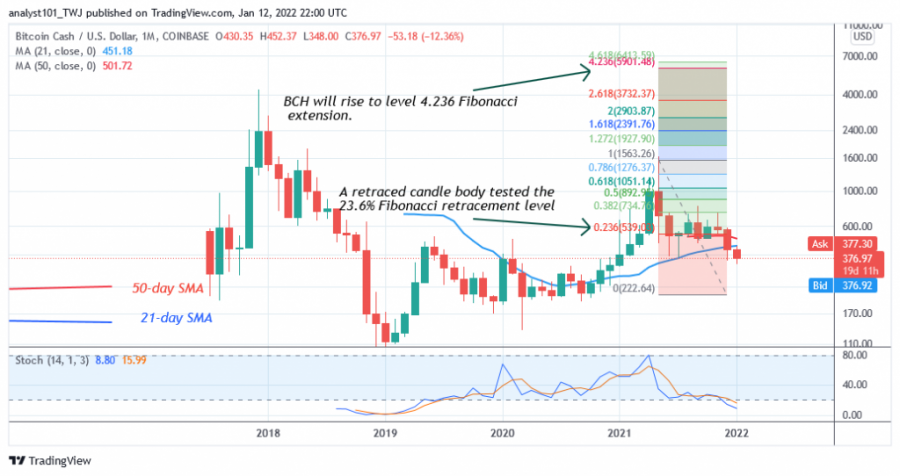
On the monthly chart, BCH has fallen into the oversold region of the market. The cryptocurrency price is moving above the $300 support. The market will resume its upward momentum once the current support holds. Should the price overcome the resistance at $1,642, BCH will rise to $4,500. On the monthly chart, a declining candlestick tested the 23.6% Fibonacci retracement level. This retracement suggests that BCH will rise to the 4,236 Fibonacci Extension level or $5,901.48.
What is the next move for Bitcoin Cash (BCH)?
Bitcoin Cash is likely to rise again if the cryptocurrency holds above the $300 support. The price indicator shows that BCH will rise to $5,901.48 once the resistance at $1,642 is broken.

Disclaimer. This analysis and forecast are the personal opinions of the author are not a recommendation to buy or sell cryptocurrency and should not be viewed as an endorsement by Coin Idol. Readers should do their own research before investing funds.
Price
Price
Price
Price
Price

(0 comments)