Ethereum Is In A Vertical Rally And Has Reached A High Of $3,720

The price of Ethereum (ETH) has resumed its uptrend, rising and breaking above the 50-day SMA. Price analysis by Coinidol.com.
Long-term analysis of the Ethereum price: bullish
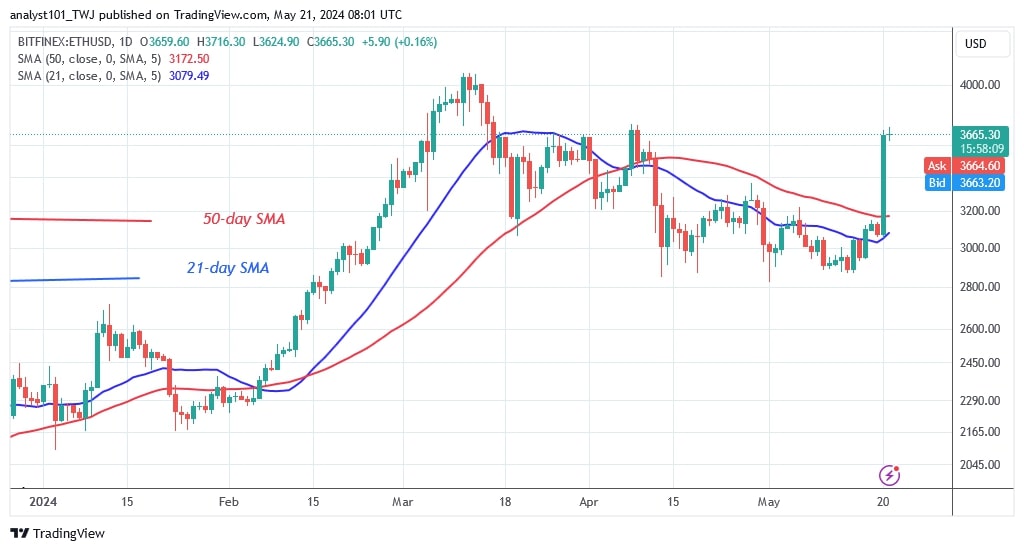
Since May 17, the largest altcoin has been trapped between moving average lines. The cryptocurrency fluctuated between the moving average lines for three days before staging a recovery. The cryptocurrency has bounced off its sideways trend. On May 20, the upward momentum broke through the 50-day SMA and rose to the $3,720 resistance level. Ether is now trading at $3,691.50. The positive trend has come to a halt as the altcoin has reached the $3,700 resistance level.
If Ether is rejected at its recent high, it could fall back to the $3,400 support, meaning the price of the altcoin will range between $3,400 and $3,700.
Analysis of the Ethereum indicator
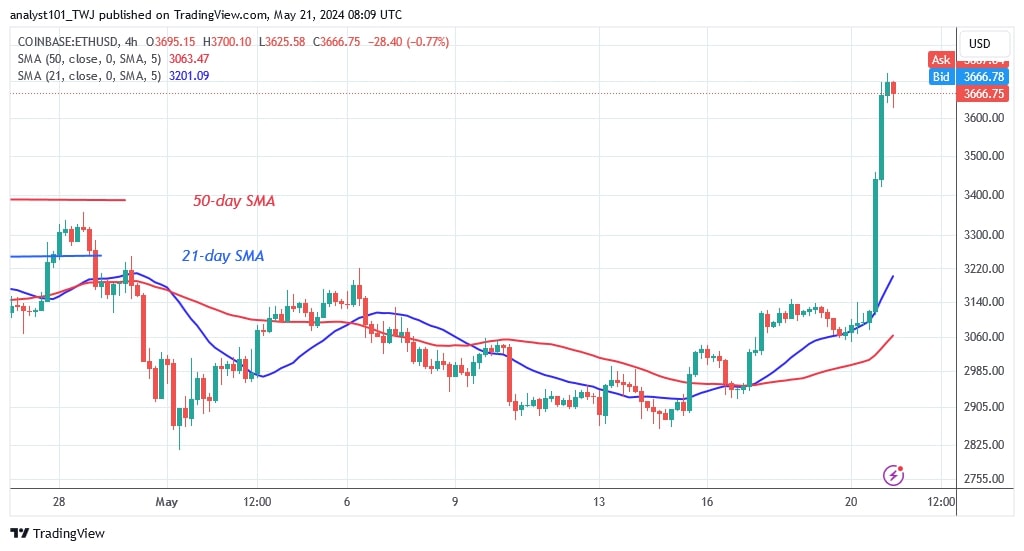
Ether has recovered in a vertical trend. The price bars have risen above their moving average lines. The vertical rally has stalled at the $3,700 mark. On the 4-hour chart, the moving average lines are sloping north with a bullish crossover. Ether's 21-day SMA has crossed above the 50-day SMA, indicating an uptrend.
Technical indicators:
Key resistance levels – $4,000 and $4,500
Key support levels – $3,500 and $3,000

What's next for Ethereum?
Ethereum has recovered from its downtrend after the May 20 breakout. Ether rose to a high of $3,720 before falling back again. The altcoin is trading below the $3,700 mark. Should the bulls overcome the $3,700 resistance, the altcoin will rise to highs of $3,800 and $4,000.

Disclaimer. This analysis and forecast are the personal opinions of the author and are not a recommendation to buy or sell cryptocurrency and should not be viewed as an endorsement by CoinIdol.com. Readers should do their research before investing in funds.
Price
Price
Price
News
Price

(0 comments)