Ethereum Slumps to $480 Low, Consolidates Between $480 and $520

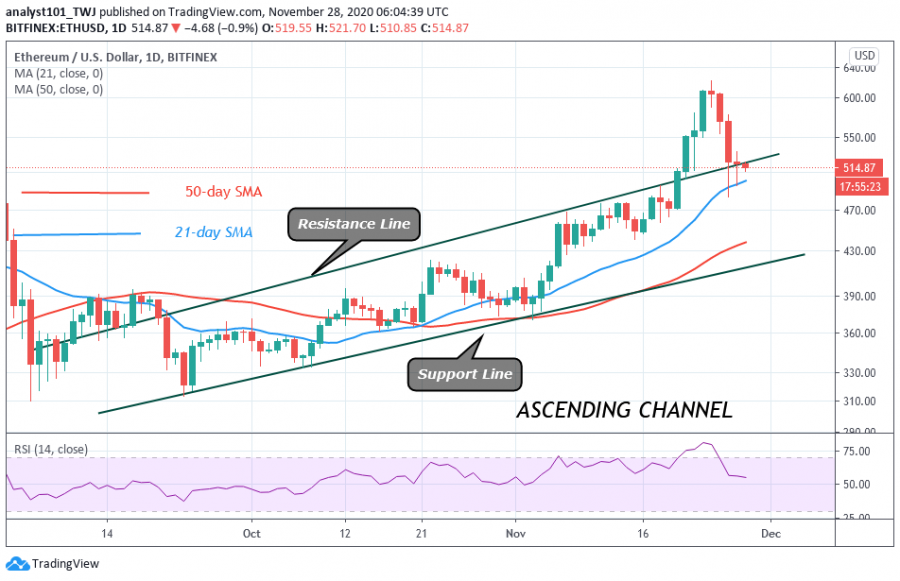
The biggest altcoin has been in a downward move soon after its rejection at the $620 resistance. Ether fell and found support above the $480 price level.
Since November 26, the coin has been fluctuating above the current support. There are some candlesticks with long tails which have indicated that there is strong buying pressure above the $480 price level.
In the meantime, ETH appears to consolidate between $480 and $520. The crypto will trend higher if the price breaks above $520 resistance. Also, the downtrend will resume if the bears succeed in breaking below $480 support. However, if these price levels remain unbroken, the range-bound movement will continue for a few more days. Ethereum is trading at $513 at the time of writing.
Ethereum indicator analysis
The crypto has been on a downward move as price breaks below the resistance line of the ascending channel. It indicates a further downward movement of the coin. On the daily chart, the price bars are above the SMAs which suggest that the coin is trading in the bullish trend zone.

Key Resistance Zones: $440, $460, $480
Key Support Zones: $160, $140, $120
What is the next direction for Ethereum?
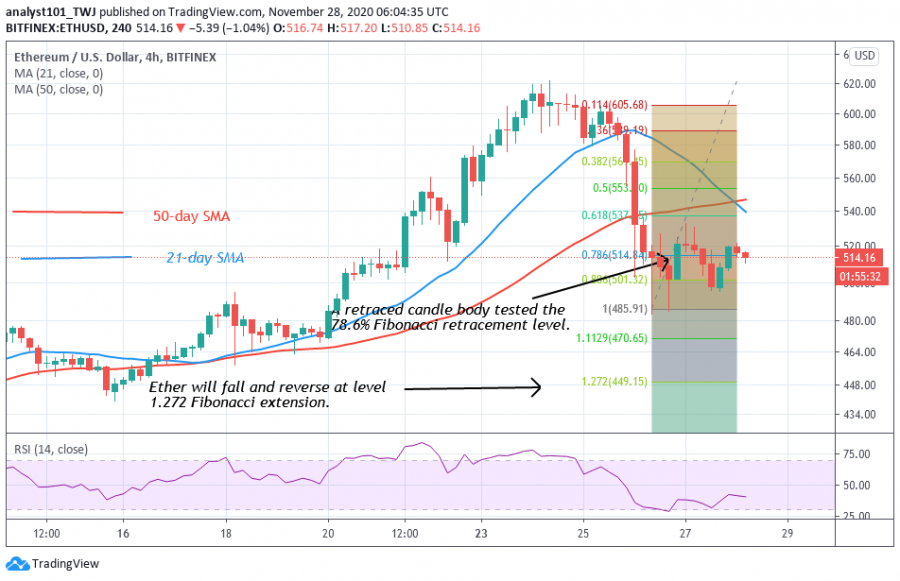
For the past three days, Ethereum fell and found support above $480 as the coin resumed consolidation between $480 and $520. According to the Fibonacci tool, the coin will further decline. On November 26 downtrend, the coin fell to $486 and moved up. The retraced candle body tested the 78.6% Fibonacci retracement level. This indicates that the coin will fall and reverse at level 1.272 Fibonacci extension level. That is the altcoin will fall and reverse at $449.15.

Disclaimer. This analysis and forecast are the personal opinions of the author that are not a recommendation to buy or sell cryptocurrency and should not be viewed as an endorsement by CoinIdol. Readers should do their research before investing funds.
Price
Price
Price
News
Price

(0 comments)