Ethereum Slips Above Its Critical Support At $2,300
Updated: Oct 27, 2024 at 20:47

Ethereum (ETH) has slipped below its moving average lines after selling pressure near the $2,800 high.
Long-term analysis of the Ethereum price: bearish
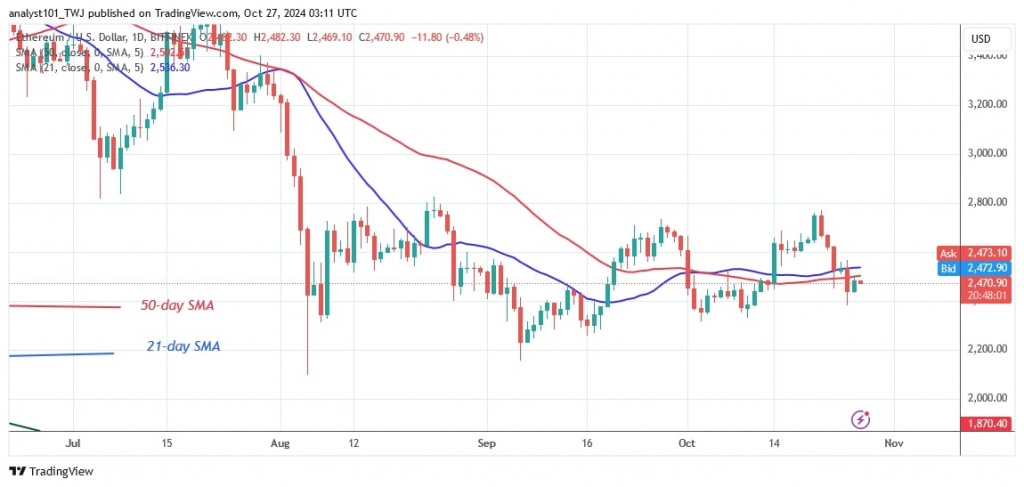
The largest altcoin has returned to the $2,200 to $2,800 price range. The bears maintained their lead as Ether fell further below the moving average lines.
On October 25, Ether fell to a low of $2,380 before recovering. The altcoin is falling again as it faces further rejection at its recent high. If Ethereum loses critical support at $2,300, it will fall back to its previous low of $2,200, while the altcoin is trading above the $2,300 support but below the moving average lines, which are key support. The largest altcoin is currently worth $2,476 after its recent drop.
Analysis of the Ethereum indicator
The price bars are falling below the moving average lines. However, the development of doji candlesticks could prevent a further decline. Since August 5, the moving average lines have remained horizontal as Ether trades between $2,200 and $2,800, as reported by Coinidol.com.
Technical Indicators:
Major Resistance Levels – $4,000 and $4,500
Major Support Levels – $3.500 and $3,000

What is the next direction for Ethereum?
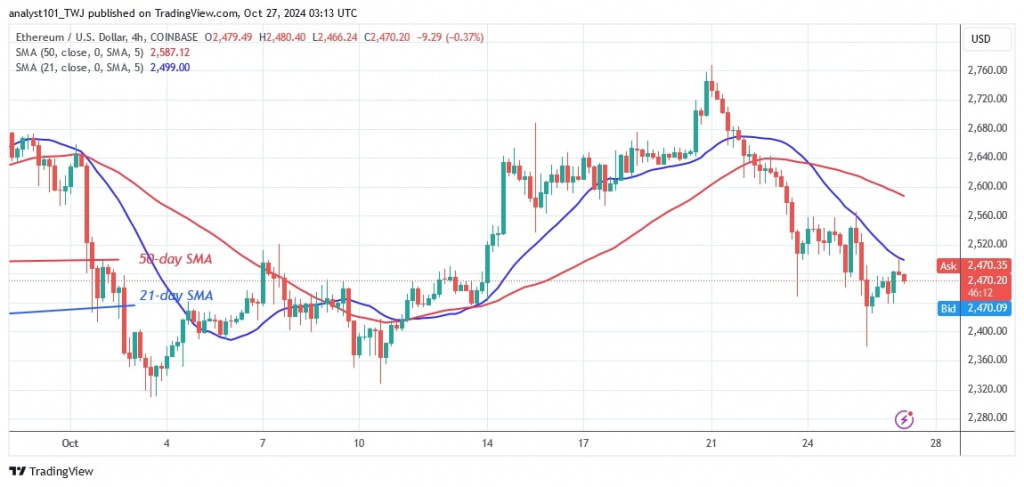
On the 4-hour chart, Ether is in a downtrend. The long candlestick tail pointing to the current support at $2,400 indicates strong buying pressure at the lower price level. The altcoin is consolidating as the doji candlesticks appear at the current support. This will stop the current decline.
Disclaimer. This analysis and forecast are the personal opinions of the author. They are not a recommendation to buy or sell cryptocurrency and should not be viewed as an endorsement by CoinIdol.com. Readers should do their research before investing in funds.
News
News
Coin expert


(0 comments)