Ethereum Remains Below $3,600 And Continues Its Range
Updated: Mar 25, 2024 at 19:00

The price of Ethereum (ETH) falls but remains between the moving average lines.
Long-term analysis of the Ethereum price: bearish
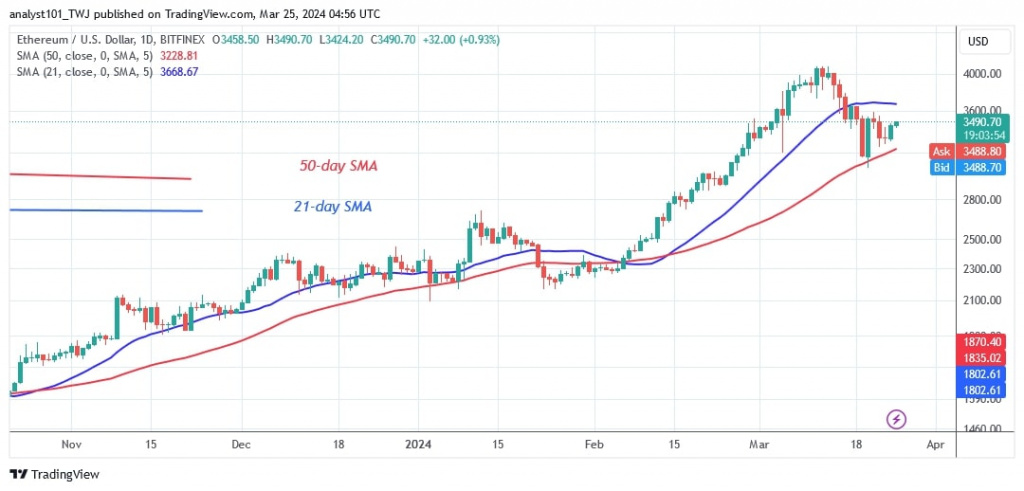
The altcoin has been trading between the moving average lines over the past week. In other words, Ether is moving between $3,200 and $3,600 price levels. The price movement has been stable as traders enter a period of hesitation.
Should buyers keep the price above the 21-day SMA, Ether will return to its previous high of $4,100. Selling pressure will return if sellers take control and break below the 50-day SMA. Ether will then fall above the $2,715 breakout level. In the meantime, Ether is currently worth $3,481.70.
Ethereum indicator analysis
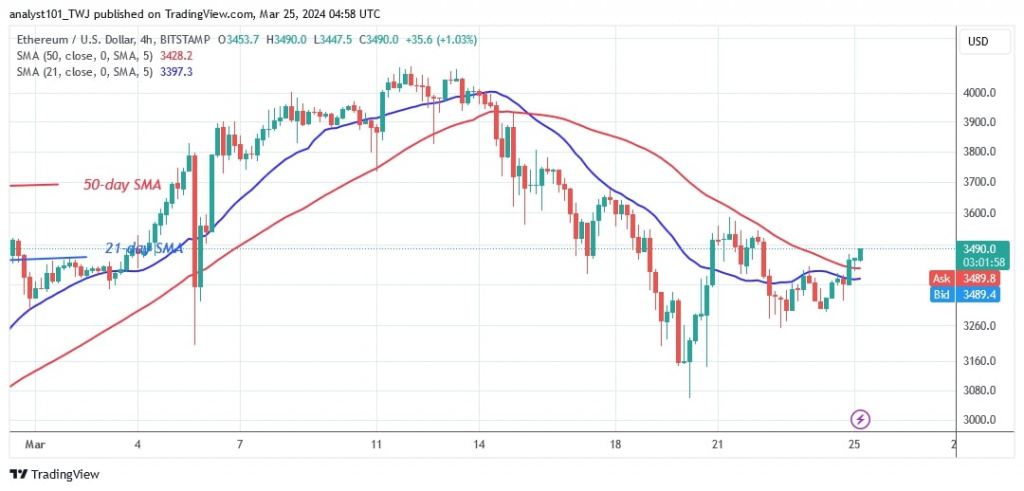
Ethereum's price bars have been fluctuating between the moving average lines. The current compulsion is keeping Ether stable above the support level of $3,000. On the 4-hour chart, Ether is rising above the moving average line, but the uptrend is halted below the resistance level of $3,600. Regardless of the decline, the moving average lines are sliding upwards.
Technical indicators:
Key resistance levels – $4,000 and $4,500
Key support levels – $3,500 and $3,000

What is the next direction for Ethereum?
The largest altcoin has been stuck in a range over the past week. Traders are undecided about the direction of the market, leading to the current price fluctuations. In addition, the appearance of uncertain candles with small bodies shows traders' attitude towards the market trend. If the moving average lines are broken, Ether will move into a trend.

Disclaimer. This analysis and forecast are the personal opinions of the author and are not a recommendation to buy or sell cryptocurrency and should not be viewed as an endorsement by CoinIdol.com. Readers should do their research before investing in funds.
News
News
Coin expert

(0 comments)