Ethereum Regains Bullish Momentum, Struggles below $4,400 Resistance Zone

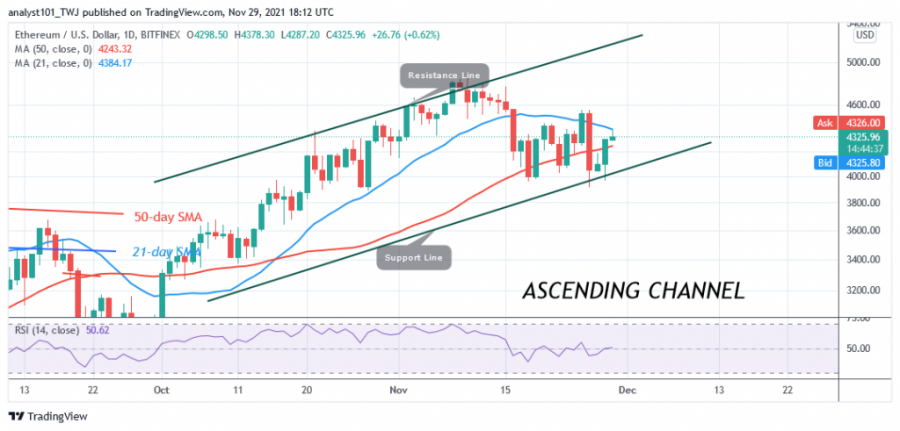
Ethereum (ETH) price is now above the 50-day line and below the 21-day moving averages. This suggests that the upside or downside will depend on the break of these moving averages.
About 48 hours later, Ether regained bullish momentum above $4,000 support. Buyers have a tough task ahead to push Ether above the moving averages and retest upper resistance at $4,800. Today, Ethereum broke out above the 50-day moving average. A break above the 21-day line SMA will push ETH to retest the upper resistance at $4,800. On the other hand, if the altcoin is rejected at the recent high, ETH/USD will be forced to range above the 50-day moving average.
Ethereum indicator analysis
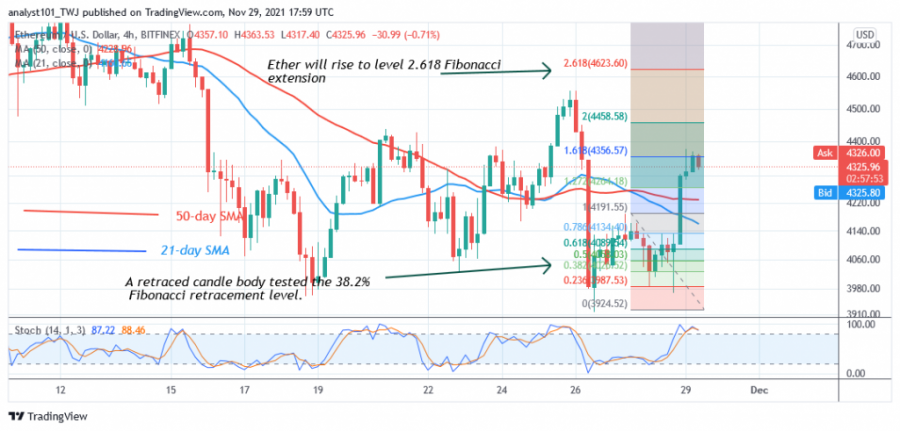
Ether is at the 50 level of the Relative Strength Index for the 14 period, indicating that there is a balance between supply and demand. The moving averages are upward sloping, indicating an uptrend. The cryptocurrency has resumed its uptrend. It is above the 80% area of the daily stochastic. The current uptrend is likely to be rejected as the altcoin reaches an overbought area of the market.

Technical indicators:
Major Resistance Levels - $4,500 and $5,000
Major Support Levels - $3,500 and $3,000
What is the next direction for Ethereum?
On the 4-hour chart, Ethereum is back on the upside as the price has risen above the moving averages. The altcoin is facing resistance at the $4,400 level. Meanwhile, the uptrend from November 27 tested the 38.2% Fibonacci retracement level with a retreating candlestick. The retracement suggests that Ether will rise to the 2.618 Fibonacci Extension level or $4,623. From a price perspective, buyers are struggling to continue the current uptrend below the $4,400 resistance zone.

Disclaimer. This analysis and forecast are the personal opinions of the author and are not a recommendation to buy or sell cryptocurrency and should not be viewed as an endorsement by CoinIdol. Readers should do their research before investing funds.
Coin expert
News
Price
Price
Price

(0 comments)