Ethereum Price Holds Above $3,000 As Buyers Jump Back In
Updated: Mar 20, 2024 at 20:45

The price of Ethereum (ETH) has fallen further after breaking below the 21-day SMA. Price analysis by Coinidol.com.
Long-term analysis of the Ethereum price: bearish
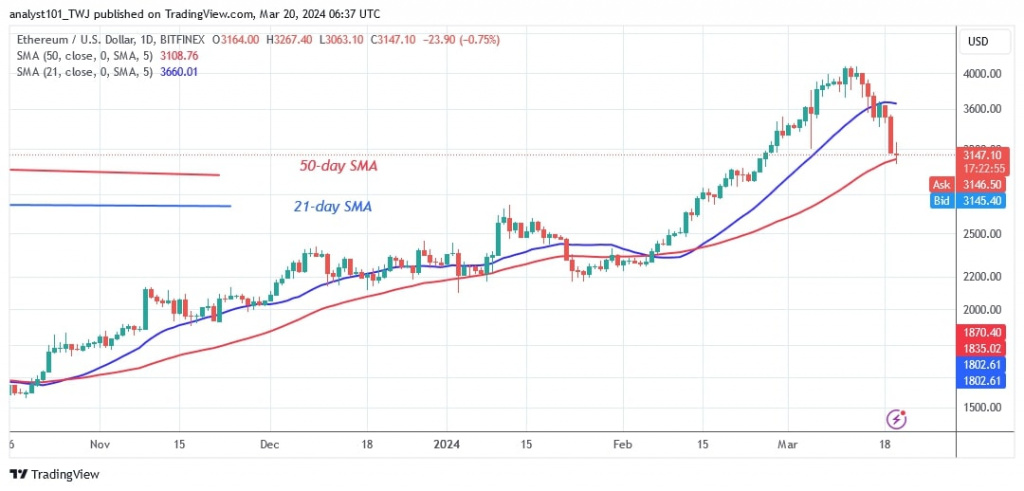
The bearish momentum has pushed above the $3,400 low and then above the $3,000 support. In other words, the bulls have stopped the slide above the 50-day SMA or the low of $3,116.
Ether price is hovering above the 50-day SMA while the bears are threatening to push it lower. If Ether stays above the 50-day SMA, it will resume its uptrend. The cryptocurrency will rise above, test or break through the 21-day SMA. Ether will reach its recent high of $4,095.
If the bears break below the 50-day SMA, Ether will fall below the $2,900 support. At the time of writing, Ether is currently worth $3,151.
Analysis of the Ethereum indicators
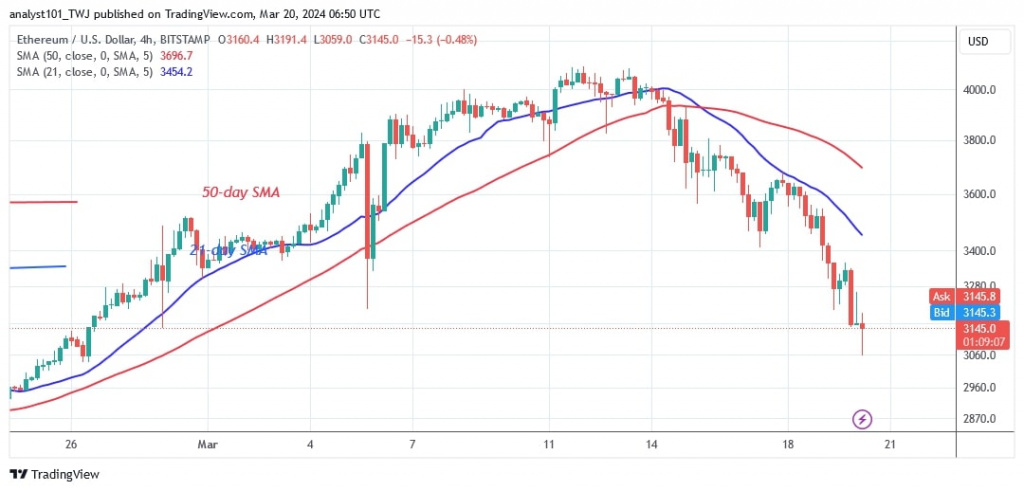
The price of Ethereum has pulled back above the 50-day SMA but remains trapped between the moving average lines. The cryptocurrency will continue to fluctuate as long as the price bars remain between the moving average lines. The price bars on the 4-hour chart are below the moving average lines, indicating that Ether is bearish. The moving average lines indicate a bearish crossover, with the 21-day SMA falling below the 50-day SMA.
Technical Indicators:
Key resistance levels – $4,000 and $4,500
Key support levels – $3,500 and $3,000

What is the next direction for Ethereum?
Selling pressure on Ether is easing as the altcoin rises above the $3,000 support level. Long candlestick tails point to the current support level, indicating strong buying interest at lower levels. Ether has reached bearish exhaustion and is hovering above the current support at $3,000.

Since March 8, buyers have made several attempts to keep the price above the psychological $4,000 level, as reported by Coinidol.com.
Disclaimer. This analysis and forecast are the personal opinions of the author and are not a recommendation to buy or sell cryptocurrency and should not be viewed as an endorsement by CoinIdol.com. Readers should do their research before investing in funds.
News
News
Coin expert

(0 comments)