Ethereum Overcomes $620 Resistance but Pauses above Support to Contemplate Next Move

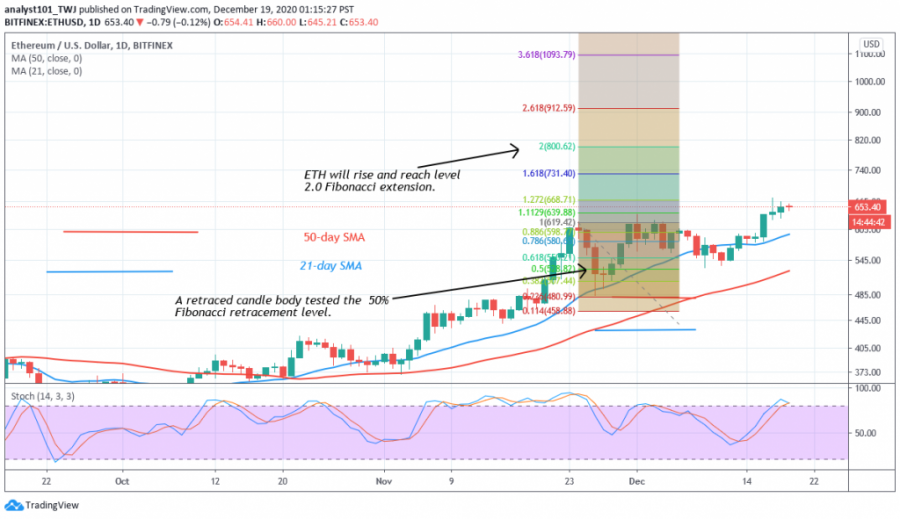
Ether’s recent breakout above $620 was short-lived as the coin rallied to the $680 resistance zone and pulled back. The pullback was above the previous resistance, now a support level at $620. Presently, Ether is above 80% range of the daily stochastic indicator. It means that the coin has reached the overbought region of the market.
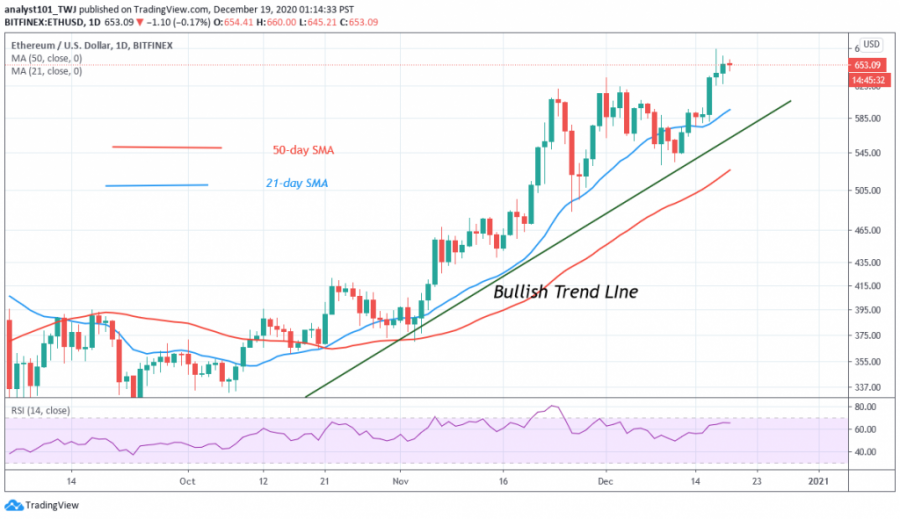
Also, the crypto is at level 67 of the Relative Strength index period 14. It means that the coin is almost in the overbought region of the market. Ethereum has not gotten enough room to rally on the upside. In the lower time frame, after the coin tested the resistance zone twice, it fell above $620 support. Ether is now fluctuating between $620 and $680 price levels.
Ethereum indicator analysis
A bullish trend line is drawn showing the support levels of price. A breakdown below the trend line will mean a downward movement of the coin. Perhaps the bullish trend will be terminated. The 21-day and 50-day SMAs are pointing northward indicating the uptrend. Ether is said to be in the overbought region of the market. In a strong trend, the overbought conditions may not hold as Ether will continue to rise.

Key Resistance Zones: $800, $820, $840
Key Support Zones: $480, $460, $420
What is the next direction for Ethereum?
The crypto is expected to rise after overcoming the minor retracement. On November 26, a retraced candle body tested the 50% Fibonacci retracement level. The retracement indicates that ETH will rise and reach level 2.0 Fibonacci extensions. In other words, the market will reach a high of $800.62

Disclaimer. This analysis and forecast are the personal opinions of the author that are not a recommendation to buy or sell cryptocurrency and should not be viewed as an endorsement by CoinIdol. Readers should do their research before investing funds.
Price
Coin expert
Price
News
Price

(0 comments)