Ethereum Is In A Range Bound Move, Indicating A Possible Rise
Updated: May 19, 2023 at 16:16

After the decline on May 11, the price of Ethereum (ETH) is fluctuating.
Long-term analysis of the Ethereum price: bearish
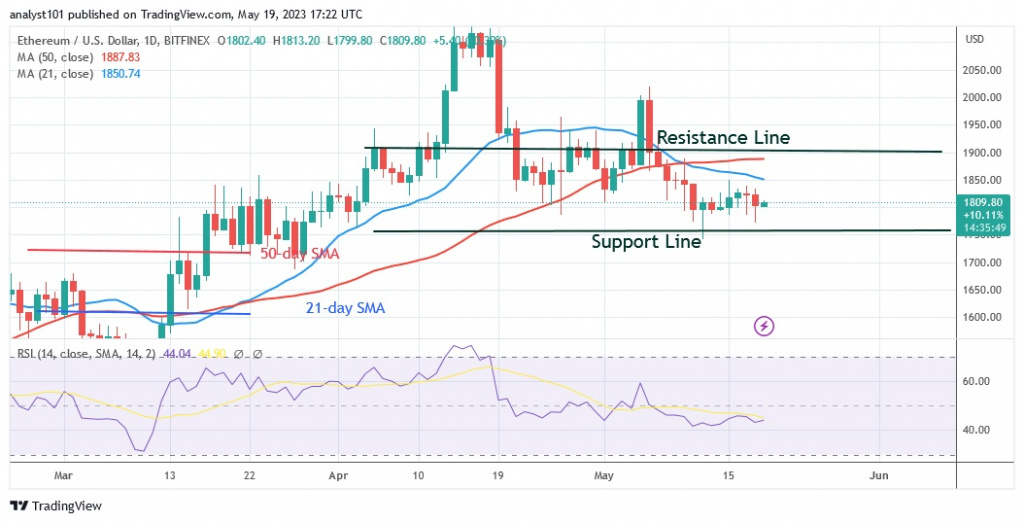
The largest altcoin is currently trading above the support level of $1,740 but below the moving average lines or resistance level of $1,900. Today, at the time of writing, one Ether is worth $1,812.30. Due to the presence of Doji candlesticks, price movement has been minimal since the May 11 decline. As long as Doji candlesticks prevail in the price movement, the current movement or consolidation will continue within a certain range. If the altcoin gains momentum, Ether will move. If Ether rises above the current support, the uptrend will return. Ether will rise above the moving average lines and resistance at $1,900 thanks to the resulting uptrend. The cryptocurrency will eventually return to its high of $2,000. However, Ether has already turned away from the previous downtrend. It is unlikely that the downward pressure will increase further.
Analysis of Ethereum indicators
The largest altcoin is at level 44 on the Relative Strength Index for the period 14. Ether is consolidating above the current support and is in the bearish trend zone. The price bars have been below the moving average lines since May 8, indicating a possible decline. The altcoin is above the 50 level of the daily stochastic and has positive momentum. The bullish momentum is less pronounced now.

Technical indicators:
Key resistance levels - $2,000 and $2,500
Key support levels - $1,800 and $1,300
What does the next direction look like for Ethereum?
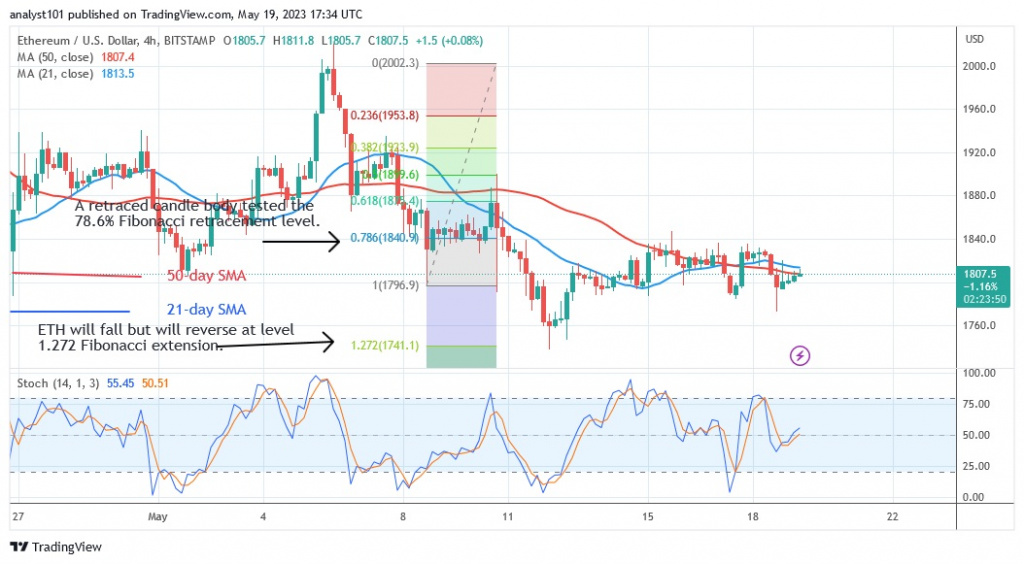
The data on the 4-hour chart shows that the price of Ether has deviated from a negative trend at the level of the 1,272 Fibonacci extension, or $1,741. The price activity indicates that Ether corrected upwards, but was rejected in the area of the $1,850 resistance. Due to the rejection, the altcoin is currently moving sideways.

Disclaimer. This analysis and forecast are the personal opinions of the author and are not a recommendation to buy or sell cryptocurrency and should not be viewed as an endorsement by CoinIdol. Readers should do their research before investing in funds.
Price
Price
News
News
Coin expert

(0 comments)