Ethereum Holds Above $1,180, Further Price Declines Likely
Updated: Dec 30, 2022 at 17:13

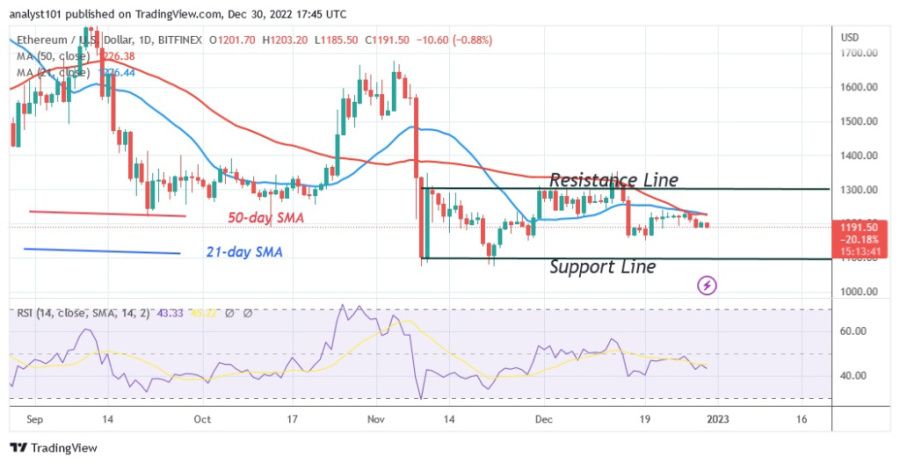
Ethereum (ETH) is in a downtrend after a recent rejection at the moving average lines. The largest altcoin is now trading above the support level of $1,184.
Long-term analysis of the Ethereum price: bearish
Ether has been consolidating above the current support but below the moving average lines for the past three days. In other words, the price range between $1,100 and $1,200 has been narrowed. The moving average lines have stopped the price increase. The altcoin has to trade within a restricted range, which is below the moving average lines, and further price declines in Ether are likely as it trades in the bearish trend zone. The altcoin will fall to a low of $1,150 or $1,075 if the bearish momentum continues. It will be a challenge for buyers to resume the uptrend. If Ether bounces above the current support, the largest altcoin will resume its uptrend. The moving average lines and resistance at $1,300 are likely to be broken by the bullish momentum.
Ethereum indicator analysis
As the Relative Strength Index for period 14 is at 45, the largest altcoin is comparatively stable. In the downtrend zone, the price of Ether will continue to fall. The current decline is the result of price bars falling below moving average lines. Ether has crossed the daily stochastic level of 40. The horizontal slope of the moving average lines indicates a sideways trend.

Technical indicators
Key resistance levels - $2,000 and $2,500
Key support levels - $1,500 and $1,000
What is the next direction for Ethereum?
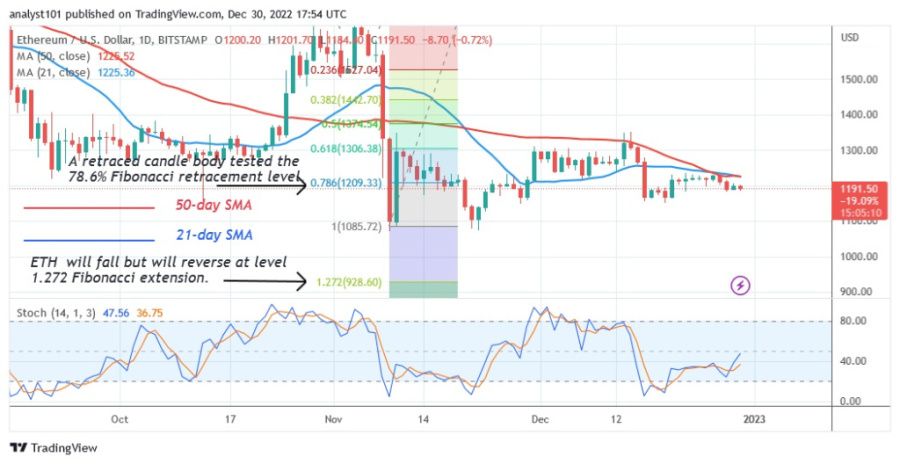
Ethereum is gradually declining as it faces resistance at the moving average lines. Reaching the next support level at $1,100 again, the largest altcoin has lost ground from its previous support level at $1,200. Ether made an upward correction during the downtrend on November 9 and a candlestick tested the 78.6% Fibonacci retracement level. The correction suggests that ETH will decline but will reverse at the Fibonacci extension at $1.272 or $928.60.

Disclaimer. This analysis and forecast are the personal opinions of the author and are not a recommendation to buy or sell cryptocurrency and should not be viewed as an endorsement by CoinIdol. Readers should do their research before investing in funds.
Price
News
Price
News
Price

(0 comments)