Ethereum Surges Ahead, Reaches the $1,424.30 January 2018 Historical Price Level

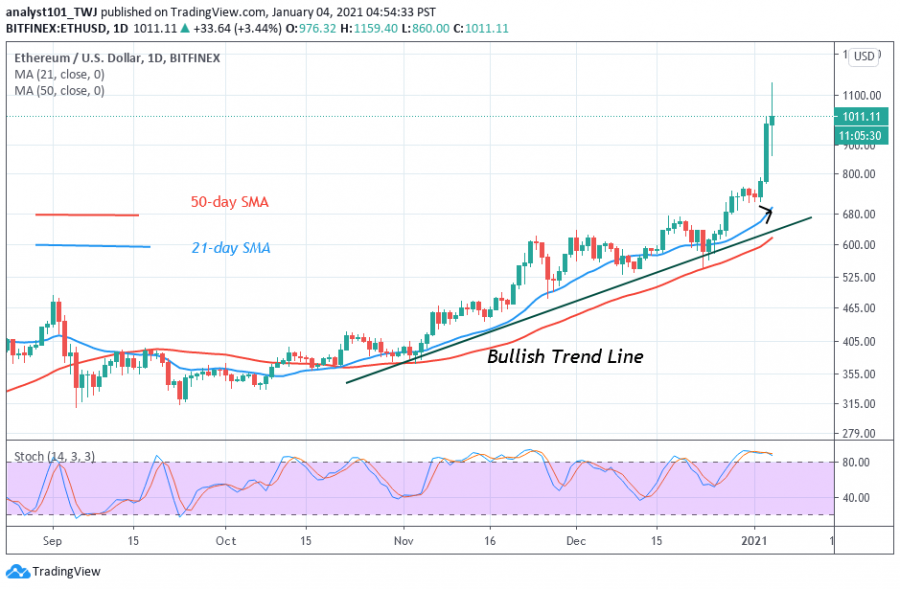
Ethereum slumped to $860 low and pulled back after rejection from the $1,100 resistance zone. The biggest altcoin is trading at $976.60 after the breakdown.
However, there is a likelihood of further downward move. Since December 30, the upward was stalled at the $760 resistance level. The bulls broke the resistance after three days of correction.
This breakout catapulted the coin to rally to $1,159.40 and pulled back. Today, Ether has broken its previous price level of $838 in April 2018. The next attempt is to break the $1,424 January 2018 historical price level. Ether is currently correcting upward, if it faces rejection, the downtrend will resume again.
Ethereum indicator analysis
The crypto is above the 80% range of the daily stochastic. It indicates that the coin is in the bullish trend zone. Today, there is the appearance of a Doji candlestick with a long tail and a short tail. It means that there is equality and indecision between buyers and sellers as no one is in control. The candlestick indicates a possible reversal of the coin.

Key Resistance Zones: $800, $820, $840
Key Support Zones: $440, $420, $400
What is the next direction for Ethereum?
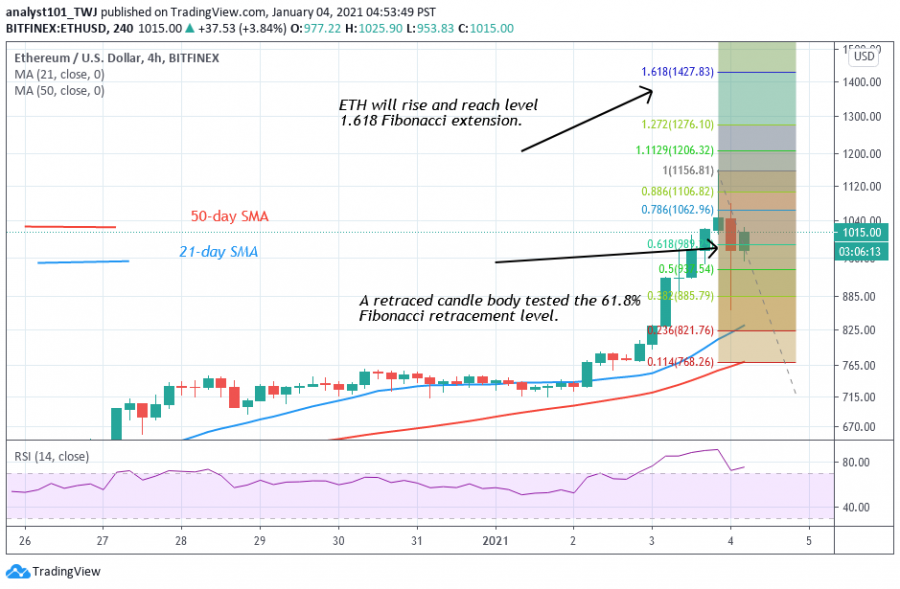
The biggest altcoin will continue its downward move if the coin faces rejection at the recent high. On January uptrend, a retraced candle body tested the 61.8% Fibonacci retracement level. This retracement indicates that ETH will rise to level 1.618 Fibonacci extension. That is the crypto will reach a high of $1,427.83

Disclaimer. This analysis and forecast are the personal opinions of the author that are not a recommendation to buy or sell cryptocurrency and should not be viewed as an endorsement by CoinIdol. Readers should do their research before investing funds.
Price
Price
Price
Price
Price

(0 comments)