Ethereum Consolidates Between $580 and $620, Reaches Vital Striking Distance above the Overhead Resistance

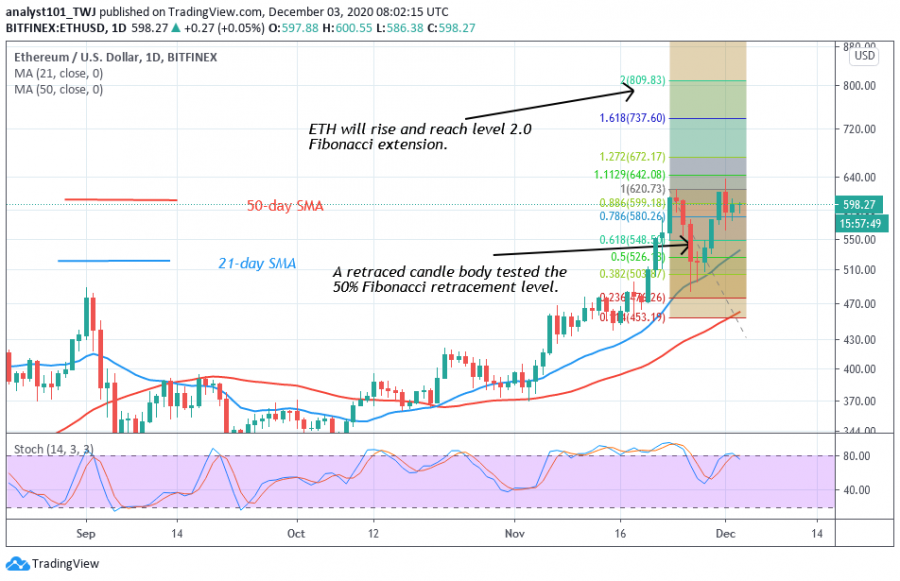
Ethereum's upward move has been compelled to a sideways move because of the bulls’ inability to overcome the $620 overhead resistance. Ethereum bulls have retested the overhead resistance twice and have failed to breach the overhead resistance.
The biggest altcoin is fluctuating between $580 and $620. The December 1’s candlestick has a long wick. It indicates that there is strong selling pressure at higher levels.
Similarly, another candlestick on the same date has a long tail. The long tail indicates that there is strong buying pressure at lower levels of price. This will compel Ether to be range-bound between the lower price range and the higher price range. When crypto is range-bound, there is a possibility of a breakout and breakdown. When a breakout occurs at $620, the coin will rise and revisit the April 30, 2018 price level of $838. A break below $580 will cause the coin to decline to $483 or $390.
Ethereum indicator analysis
Ether is at level 65 of the Relative Strength index period 14. It indicates that the coin is in the uptrend zone and above the centerline 50. The 21-day and 50-day SMA are sloping upward indicating the uptrend. However, the 21-day SMA acts as support in the bull market.

Key Resistance Zones: $440, $460, $480
Key Support Zones: $160, $140, $120
What is the next direction for Ethereum?
Ethereum's upward move is likely if the bulls break the overhead resistance. Meanwhile, the Fibonacci tool indicated an upward movement of the coin. On November 25, a retraced candle body tested the 50% Fibonacci retracement level. The retracement indicates that ETH will rise and reach level 2.0 Fibonacci extension. That is the high of $809.83

Disclaimer. This analysis and forecast are the personal opinions of the author that are not a recommendation to buy or sell cryptocurrency and should not be viewed as an endorsement by CoinIdol. Readers should do their research before investing funds.
Price
Price
Price
News
Price

(0 comments)