ETH Moves in Sideways Trend as We Wait for Market to Break the Range

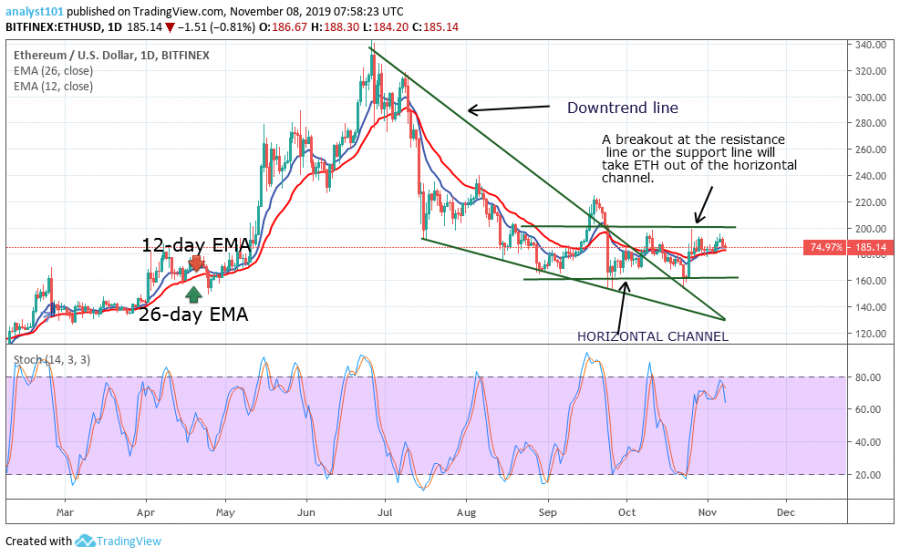
The Ethereum price has been stagnant above $180 for the past two weeks as the price fails to break the range-bound zone. Currently, the upward move has been insignificant as the price moves only by 3.33% higher. The bulls have tried to penetrate the upper price range but were repelled after each trial. After each resistance, the price will fall to the low above $180.
In the last bearish run, the price fell to the low of $160 as the bulls were on hand to defend the lower price range. The price quickly made an upward correction as the coin continues to range above the $180 price level.
Ethereum Indicator Analysis
Ethereum has been trading in a horizontal channel for the past three months. ETH will rise to a $280 price level if the resistance line of the channel is broken. However, ETH will suffer another selling pressure if the support line is breached. It will fall and reach a low of $140. Meanwhile, the 12-day and 26-day EMAs are trending horizontally as the price moves sideways.

Key Supply Zones: $280, $320, $360
Key Demand zones: $120, $80, $40
What Is the Next Move for Ethereum?
A price break either at the resistance line or the support line of the horizontal channel will determine price movement. Ethereum will still be trapped except the critical levels are broken. Nonetheless, if the horizontal channel remains intact the coin will continue its sideways move. The market is in a bearish momentum as the price is below the 80% range of the stochastic.
Disclaimer. This analysis and forecast are the personal opinions of the author are not a recommendation to buy or sell cryptocurrency and should not be viewed as an endorsement by CoinIdol. Readers should do their own research before investing funds.
News
Price
Price
Price
Price

(0 comments)