Polkadot Recovers From Downtrend But Consolidates Above $16 Support

The price of Polkadot (DOT) continued its downward correction after the price fell below the previous low of the January 22 plunge.
Polkadot (DOT) price long-term analysis: bearish
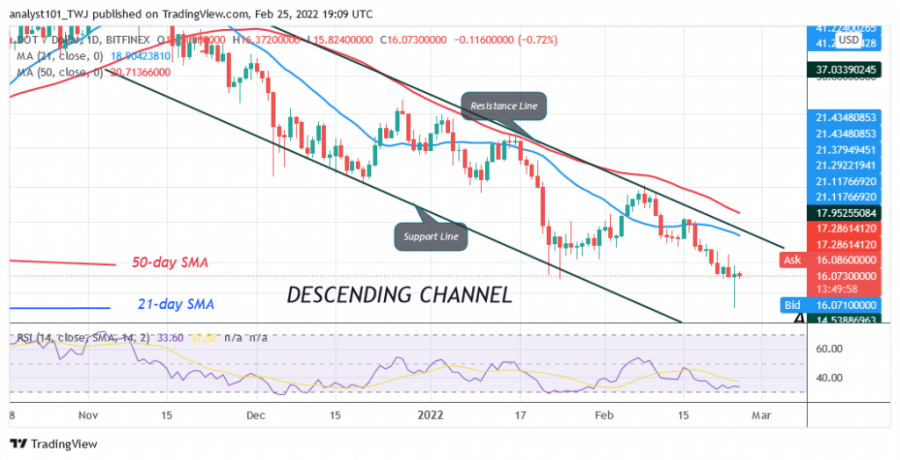
On the bearish impulse of January 22, the cryptocurrency fell to a low of $16, but the bulls bought the dips. As a result, the altcoin rose to a high of $23. The bulls could not sustain the bullish momentum above the $23 high.
Consequently, selling pressure resumes. The current downtrend reached the low of $14.07, but pulled back above the low of $16. The current bearish candlestick and the previous candlesticks have a long candle tail. These candlesticks indicate that there is strong buying pressure at the current support. Therefore, it is likely that the $16 low will hold. If DOT rises back above current support, buyers will try to regain resistance at $23. A break above the $23 high will cause Polkadot to rally above the moving averages. Moreover, the bullish momentum will extend to the high at $27.
Polkadot (DOT) indicator analysis
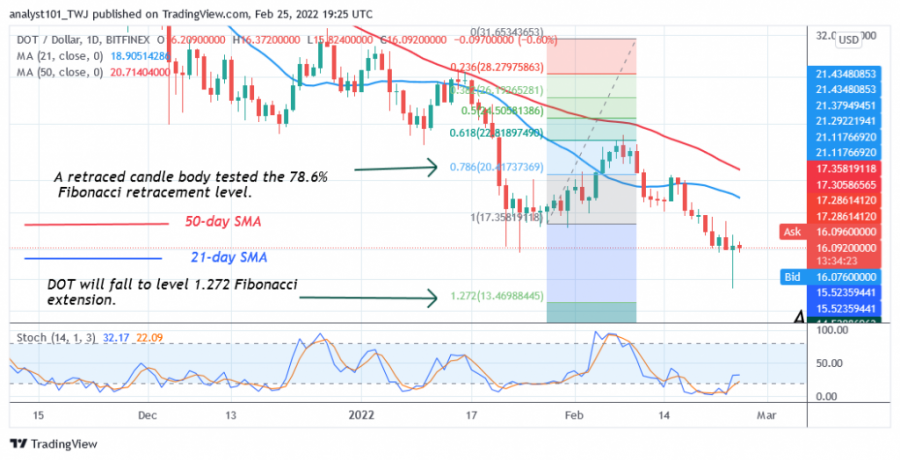
The cryptocurrency is at the level 33 of the Relative Strength Index for the period 14. The cryptocurrency has reached the oversold area of the market. Therefore, further selling pressure is unlikely. Polkadot is above the 25% area of the daily stochastic. First, the altcoin has fallen into the oversold area and has retreated. In other words, buyers are showing up to push prices higher.

Technical Indicators:
Key resistance levels - $52 and $56.
Key support levels - $28 and $24
What is the next direction for Polkadot (DOT)?
The DOT price has fallen and reached bearish exhaustion. The altcoin is on the upswing again. Meanwhile, a downtrend has started on January 22; a retracement candlestick has tested the 78.6% Fibonacci retracement level. The retracement suggests that DOT will fall to the 1.272 Fibonacci extension level or the $13.46 level. The price action shows that the altcoin is trading above the $16 support.

Disclaimer. This analysis and forecast are the personal opinions of the author are not a recommendation to buy or sell cryptocurrency and should not be viewed as an endorsement by CoinIdol. Readers should do their research before investing funds.
Price
News
Price
Price
Price

(0 comments)