Dogecoin Moves Within A Range While Facing Rejection At $0.075

Dogecoin (DOGE) price has reached bearish exhaustion since its price decline on May 8.
Dogecoin price long-term forecast: bearish
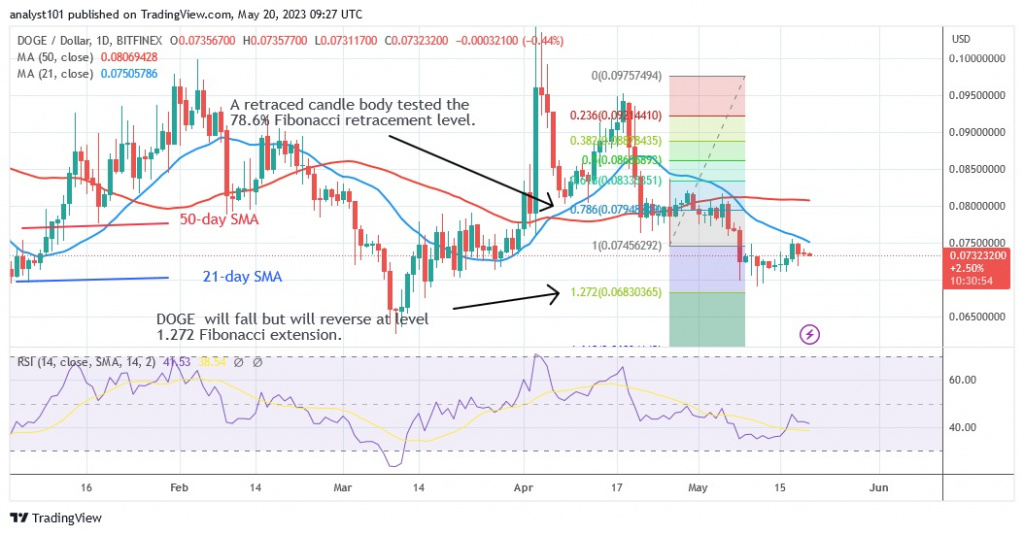
The cryptocurrency asset began consolidating above the $0.069 support not long after the decline. On May 17, DOGE rose, but the 21-day line SMA resisted it. At this point, the altcoin is trading at $0.073. Long downward candlestick tails indicate the current support. Candlestick tails indicate active buying at lower price levels. The current support level of $0.069 or $0.070 is likely to hold. The price signal indicates a possible decline and reversal at $0.068. DOGE will resume its uptrend if buyers manage to keep the price above the moving average lines or the barrier at $0.080.
Dogecoin indicator display
The price of DOGE has not changed since May 8 as Doji candlesticks have formed. As a result, the Relative Strength Index remained at the level of 41. Ultimately, the bearish trend zone poses a risk to the downside of DOGE. A possible decline is indicated by the price bars below the moving average lines.

Technical indicators
Key resistance levels - $0.12 and $0.14
Key support levels - $0.06 and $0.04
What's next for Dogecoin?
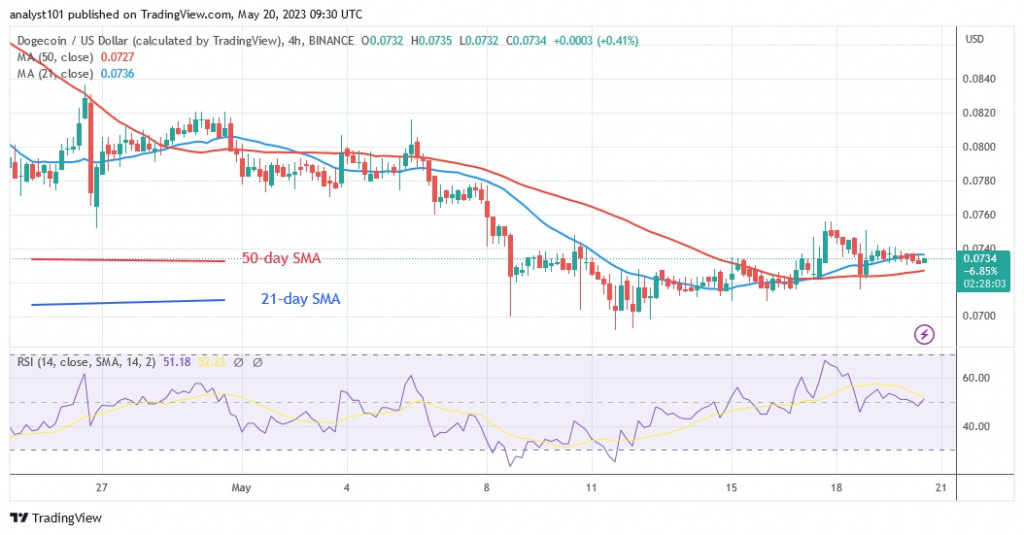
Since May 8, DOGE /USD has maintained its consolidation above recent support and slowed the downtrend. On the 4-hour chart, the cryptocurrency value is fluctuating between the moving average lines. This indicates that the altcoin will move in a range for a short period of time.

Disclaimer. This analysis and forecast are the personal opinions of the author and are not a recommendation to buy or sell cryptocurrency and should not be viewed as an endorsement by Coin Idol. Readers should do their own research before investing in funds.
Price
Price
Price
News
Price

(0 comments)