Dogecoin Price Fluctuates Between $0.19 and $0.21 as Buyers Battle $0.23 High

Dogecoin price (DOGE) has been in a sideways movement for a week. The upward movement was interrupted at the high of $0.23.
Dogecoin (DOGE) Price Long Term Forecast: In Range.
Today, the uptrend was staved off as the cryptocurrency fell into the range of fluctuation. DOGE/USD is trapped in a narrow range between $0.198 and $0.215. The current sideways movement was caused by the rejection of the price at the $0.23 resistance.
In the last 48 hours, buyers have been trying to push the cryptocurrency to the previous high. Dogecoin is capable of rising to the highs of $0.26 and $0.33 if the buyers overcome the resistances of $0.21 and $0.23. The cryptocurrency will be in the uptrend zone if the bulls are successful. Moreover, DOGE /USD will have an accelerated price movement in the uptrend zone. However, the sideways movement will continue if the bulls cannot overcome the resistance zones.
Dogecoin (DOGE) Indicator Reading
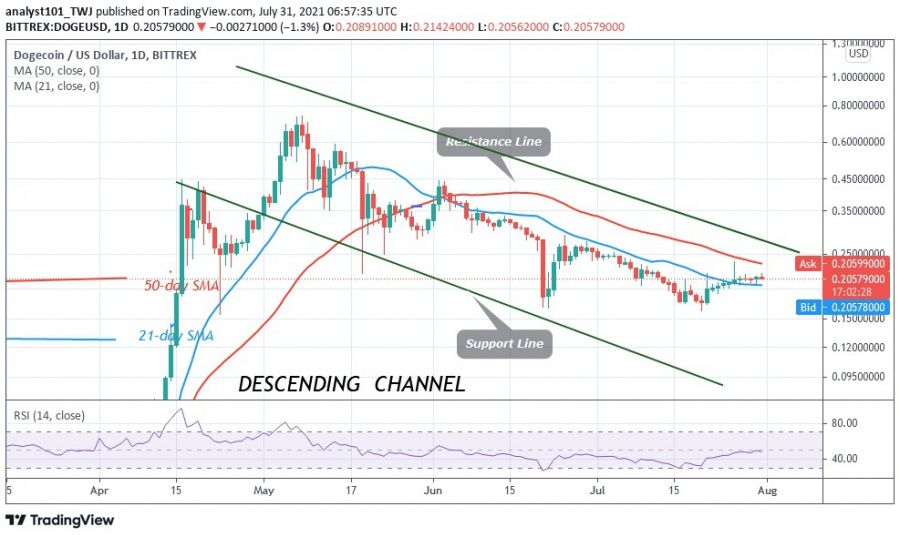
Dogecoin is at level 42 of the Relative Strength Index of period 14, which means that it is in the downtrend zone and can fall down. DOGE is above the 50% area of the daily stochastic. This indicates that the altcoin is in a bullish momentum. The 50-day and 21-day SMA lines are sloping south, indicating a downtrend.

Technical Indicators:
Resistance Levels - $0.80 and $0.85
Important Support Levels - $0.30 and $0.25
What is the next direction for Dogecoin (DOGE)?
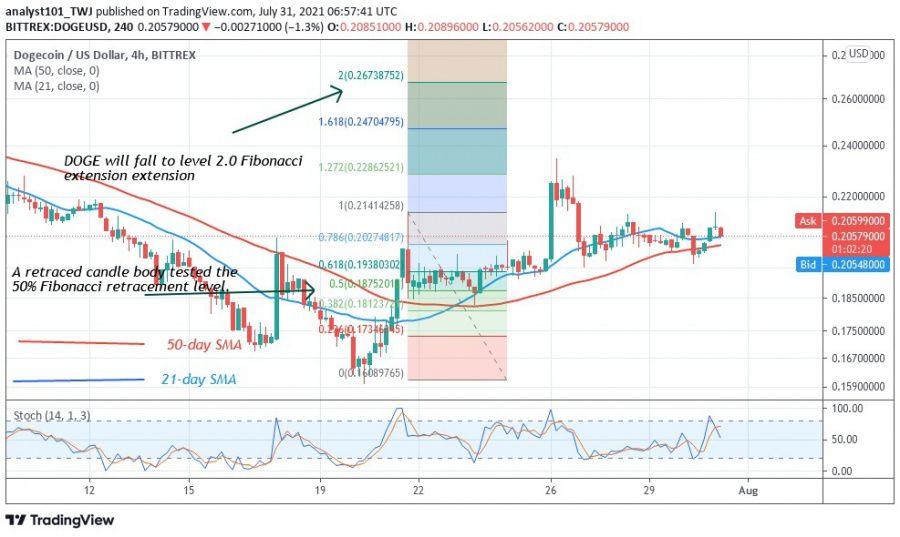
The upward movement of DOGE/USD continues despite the minor setback. The market is characterized by small candlesticks called Doji and Spinning tops. These candlesticks indicate indecision between buyers and sellers on the market direction. Meanwhile, on July 21, a candlestick tested the 50% Fibonacci retracement level. The retracement suggests that DOGE will rise to the 2.0 Fibonacci extension level or the $0.26 level.

Disclaimer. This analysis and forecast are the personal opinions of the author are not a recommendation to buy or sell cryptocurrency and should not be viewed as an endorsement by Coin Idol. Readers should do their own research before investing funds.
Price
Price
News
Price
Price

(0 comments)