Dogecoin Is Range Bound as Buyers Attempt to Breach $0.24 Resistance

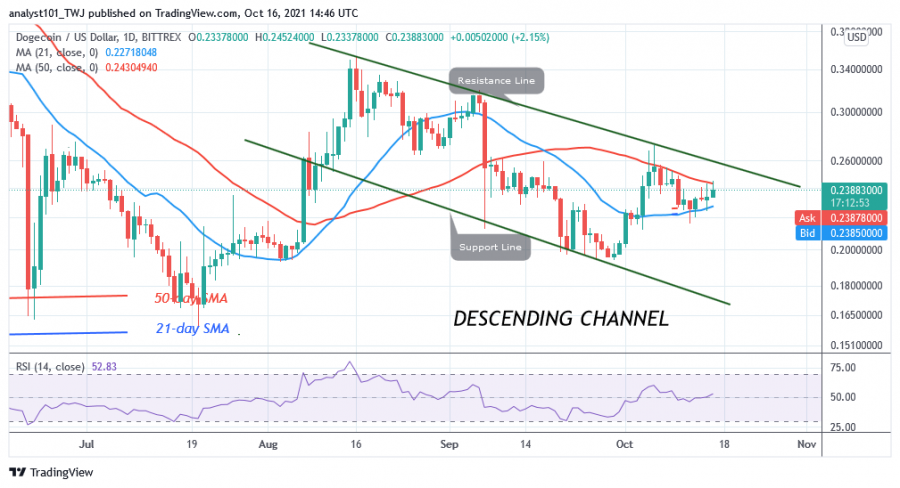
Dogecoin (DOGE) is stuck at the $0.23 price level today. The cryptocurrency has been trading between the moving averages since October 4. The price of DOGE is above the 21-day line SMA and below the 50-day line SMA.
The altcoin shows a trend when the moving averages are broken. For example, on October 6, buyers pushed the altcoin above the 50-day line SMA, but were stopped at resistance at $0.27. The cryptocurrency would have risen to $0.32 or $0.35 if buyers had been successful above this line. Nevertheless, the price of DOGE fell back to the support of the 21-day line SMA and continued its consolidation above this line. This is an indication that Dogecoin lacks buyers at higher price levels. However, if the bears break below the 21-day line SMA, the market will fall to a low of $0.19.
Dogecoin indicator reading
The cryptocurrency is at level 51 on the Relative Strength Index for period 14, which explains that there is a balance between supply and demand. The balance could be in favor of sellers as the altcoin fluctuates above the 21-day line SMA. The direction of the market is determined when the moving averages are broken.

Technical indicators:
Major Resistance Levels - $0.80 and $0.85
Major Support Levels - $0.45 and $0.40
What is the next direction for Dogecoin?
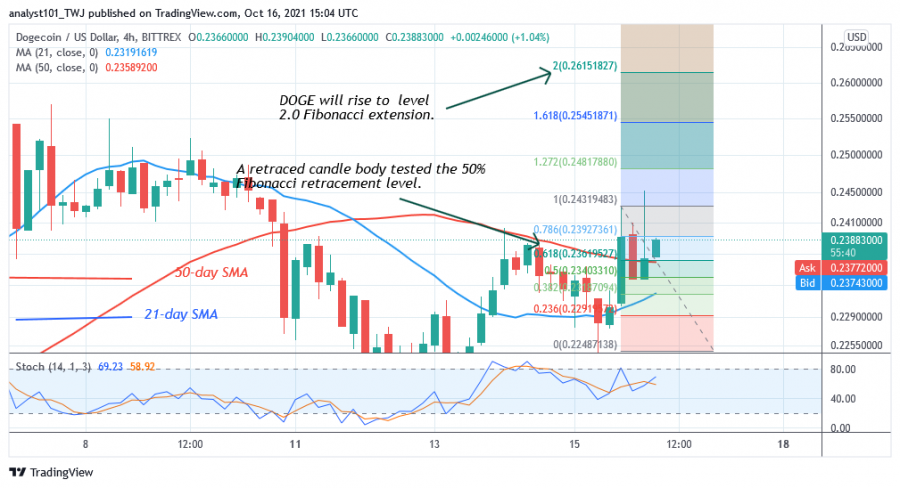
On the 4-hour chart, DOGE/USD is showing an upward movement as the price breaks above the moving averages. DOGE has fallen back above the support of the moving averages. The Fibonacci tool has indicated a possible move in cryptocurrency. Meanwhile, the price entered an uptrend on October 15. A retreating candlestick has tested the 50% Fibonacci retracement level. This retracement suggests that the altcoin will rise to the 2.0 level of the Fibonacci extension or to the $0.26 level.

Disclaimer. This analysis and forecast are the personal opinions of the author and are not a recommendation to buy or sell cryptocurrency and should not be viewed as an endorsement by Coin Idol. Readers should do their own research before investing funds.
Price
Price
News
Price
Price

(0 comments)