DASH Consolidates Sideways, as Bears Threaten to Short
Updated: Jun 26, 2020 at 13:23

Following the breakdown on June 11, the market dropped to a $72 low. Sellers attempted to make a further downward push but were stopped at $70 support.
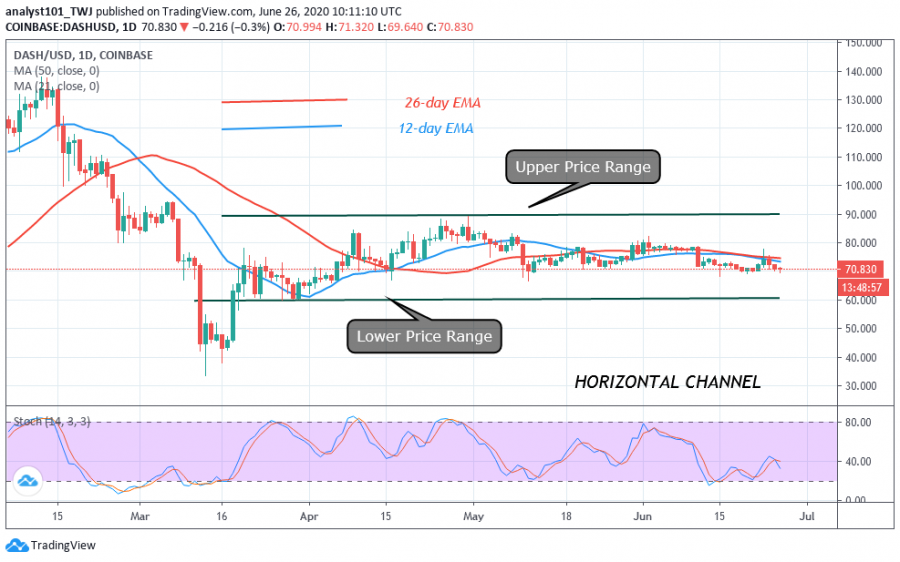
Buyers also made upward correction but the upward move was resisted at $75. DASH is currently consolidating between $70 and $75. In retrospect, DASH was earlier in a bull market when it attained a peak price of $90. After the bulls were resisted at the recent high the market dropped to $80 low.
Price corrected upward and retested the $82 high but the market dropped to $72 low. Today, DASH is in a tight range between $70 and $75. On the upside, a strong bounce above $72 will propel price to break the resistance at $75 and $78. The momentum will extend to retest the $82 resistance. However, DASH can easily fall to $60 low as bears break the $70 support. The downtrend is ongoing.
DASH indicator reading
The 12-day EMA and the 26-day EMA are horizontally flat. It indicates that the market is in a sideways trend. DASH has continued to fall because the price bars are below the EMAs. The reverse will be the case if the price is above the EMAs. The crypto is below the 40 % range of the daily stochastic. It indicates that the market has bearish momentum.

Key Resistance Zones: $100, $140, $180
Key Support Zones: $80, $60, $40
What is the next direction for DASH?
The crypto is gradually approaching the oversold region of the market. In the oversold region, the selling pressure will be exhausted as buyers emerge. The price action is indicating a bearish signal. There is a possibility of price falling from $70.570 to $70 low.
Disclaimer. This analysis and forecast are the personal opinions of the author that are not a recommendation to buy or sell cryptocurrency and should not be viewed as an endorsement by CoinIdol. Readers should do their own research before investing funds.
Price
Price
News
News
Price

(0 comments)