Weekly Cryptocurrency Market Analysis: Altcoins Fall While Cryptos Move Into Oversold Territory
Updated: May 09, 2023 at 15:53

The decline in cryptocurrency prices this week was accelerated when they deviated from the moving average lines. Cryptocurrencies dropped significantly as they approach oversold areas of the market. Let us take a look at these cryptocurrencies one by one.
Sui
Sui (SUI) is bearish as it crosses below the moving average lines. The cryptocurrency value has reached the oversold area of the market. The altcoin is trading for $1.14 at the time of writing. During the decline that started on May 5, SUI made an upward correction and a candlestick tested the 61.8% Fibonacci retracement level. SUI will fall to the 1.618 level of the Fibonacci series or the $1.11 level after the adjustment. On May 8, the altcoin tested the Fibonacci extension again and fell. The cryptocurrency is in a positive trend when the daily stochastic threshold is above 40. Sui is the cryptocurrency with the worst performance and has the following characteristics:
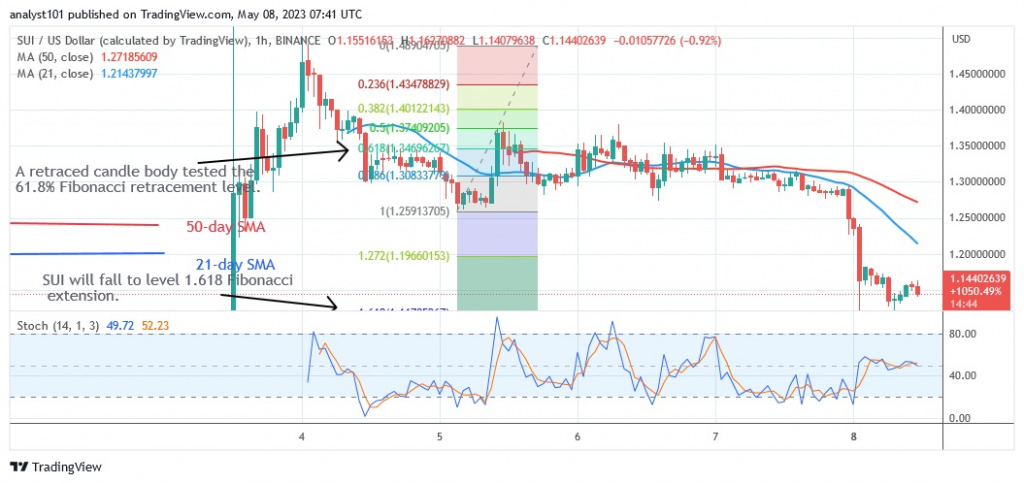
Current price: $1.14
Market capitalization: $11.385.171.310
Trading volume: $405,881,588
7-day gain/loss: 74. 57%
PancakeSwap
PancakeSwap (CAKE) price is falling and has dropped significantly. The cryptocurrency's value dropped from a high of $4.73 to a low of $1.93. At the time of writing, the altcoin is currently trading at $1.93. According to the price indicator, CAKE will fall to the $1.89 level or the 2.518 Fibonacci extension level. CAKE has been testing the downward 2.618 Fibonacci extensions while rising above the current support. The altcoin is currently in bearish momentum as it approaches the oversold area of the market. It is at level 12 of the Relative Strength Index for period 14, indicating that the oversold area of the market has been reached. CAKE is the coin with the second worst performance this week. It has the following characteristics:
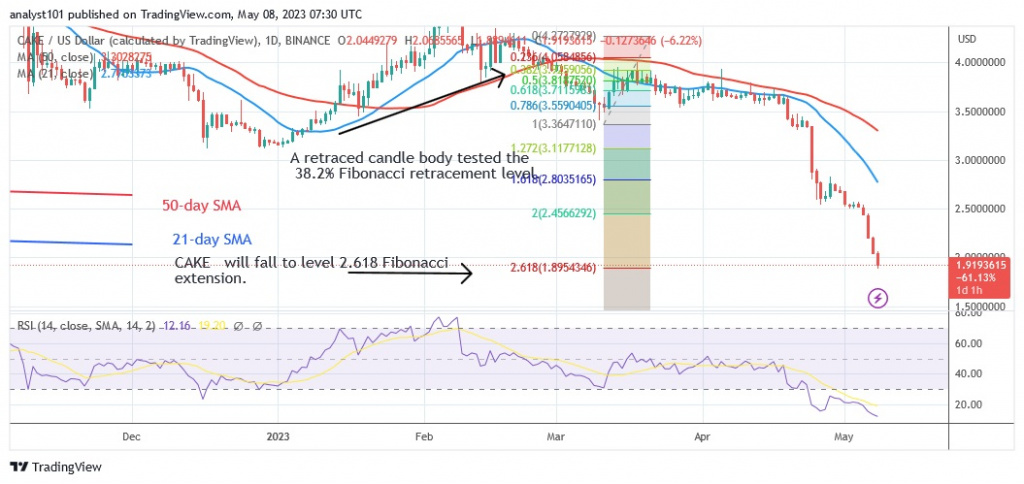
Current price: $1.9426
Market capitalization: 385,153,929.86
Trading volume: $65,965,724
7-day gain/loss: 27.41
Render Token
Render Token (RNDR) price is decreasing between the moving average lines. The previous rise of the asset was stopped at a high of $2.40 for the coin. The value of the altcoin has been declining since May 1. Selling pressure reached a low of $1.88 today. The oversold area of the market for the altcoin is also getting closer. RNDR is in the area between the moving average lines. While the cryptocurrency is trading above the 50-day line SMA, it is trading below the 21-day line SMA. RNDR will suffer further losses if the price falls below the 50-day line SMA. On the other hand, the altcoin will be forced to move in a range if the 50-day line SMA holds. The daily stochastic threshold of 40 indicates a bearish trend for the coin. RNDR is the third worst cryptocurrency. It has the following characteristics:
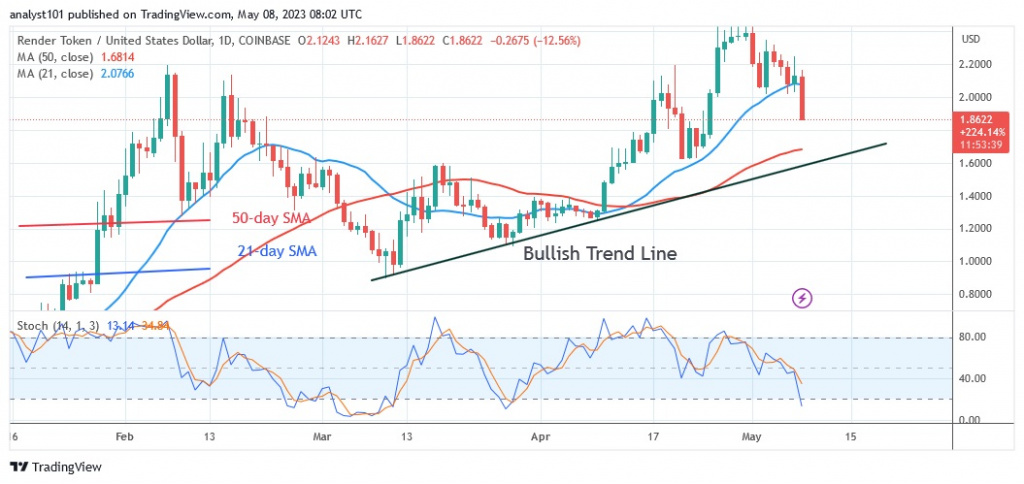
Current price: $1.88
Market capitalization: $1,018,801,450
Trading volume: $155,774,671
7-day gain/loss: 19.29%
Immutable
The price of Immutable (IMX) is falling as it drops below the moving average lines. The cryptocurrency fell to its previous low of $0.78. Moreover, IMX is retesting the current support at $0.78 as this article is being written. However, the price signal indicated that Bitcoin would continue to fall. During the downturn that started on March 27, IMX experienced an upward correction and a candlestick tested the 61.8% Fibonacci retracement level. After the adjustment, IMX will fall to the 1.618 Fibonacci sequence level or to the $0.065 level. IMX is currently at level 31 of the Relative Strength Index for period 14. The oversold area of the market for the altcoin has been reached. The decline is probably over. It currently ranks as the fourth worst cryptocurrency. These are the following qualities in it:
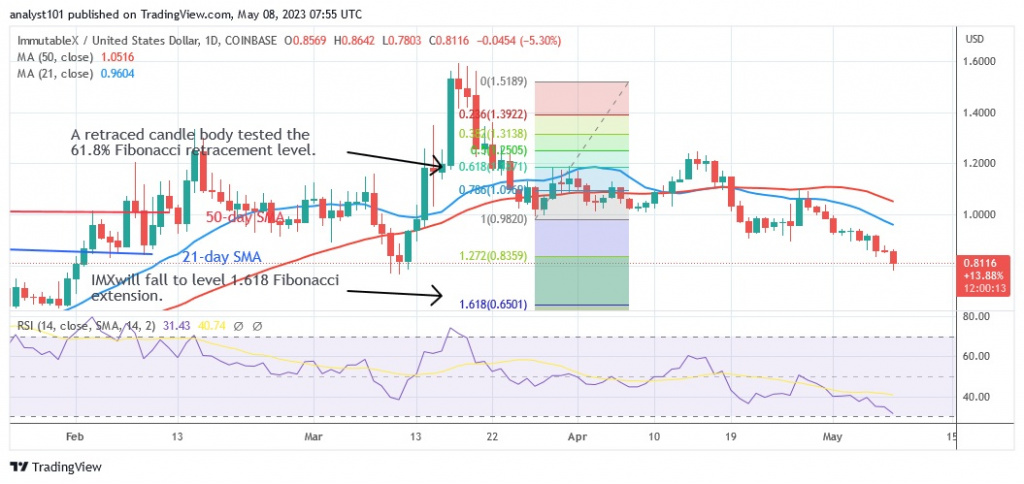
Current price: $0.8112
Market capitalization: $1,630,007,470
Trading volume: $26,231,865
7-day gain/loss:16.74
Optimism
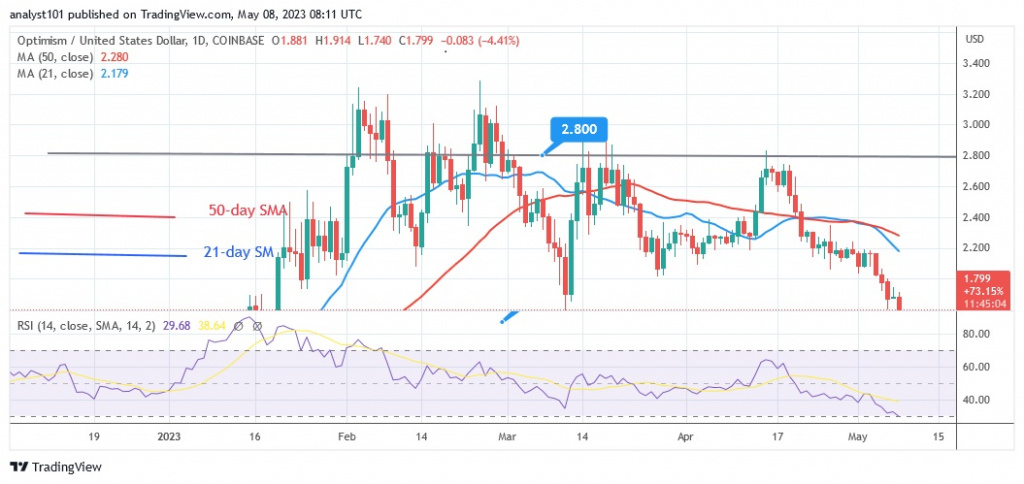
Optimism (OP) price is falling below the moving average lines. Since February 3, the cryptocurrency has been moving downwards after failing to break the $3.00 level. However, as selling pressure resumed, the cryptocurrency was once again rejected at the $2.80 high. Today, OP reached its previous low of $1.78. The price of OP will continue to fall until it reaches a low of $1.00 if the current support is broken. The 14-period Relative Strength Index currently shows the cryptocurrency at level 31, and the current decline has reached a point of bearish exhaustion. The cryptocurrency with the fifth worst performance is an altcoin with the characteristics listed below:
Current price: $0.03762
Market capitalization: $1,421,730,684
Trading volume: $4,863,272
7-day gain/loss: 15.81%
Disclaimer. This analysis and forecast are the personal opinions of the author and are not a recommendation to buy or sell cryptocurrency and should not be viewed as an endorsement by CoinIdol. Readers should do their research before investing in funds.
Price
News
Price
Price
News

(0 comments)