Cryptocurrencies Bounce but Buying Dries up at Higher Price Levels

The cryptocurrencies under review are in the bullish trend zone. In other words, Binance Coin, Cardano, TRON and MIOTA are trading above the EMAs which mean the coins intend to rise, retest or break the resistance levels. HOT has been in a sideways trend and the coin is facing further selling pressure.
BNB/USD Major Trend: Bullish
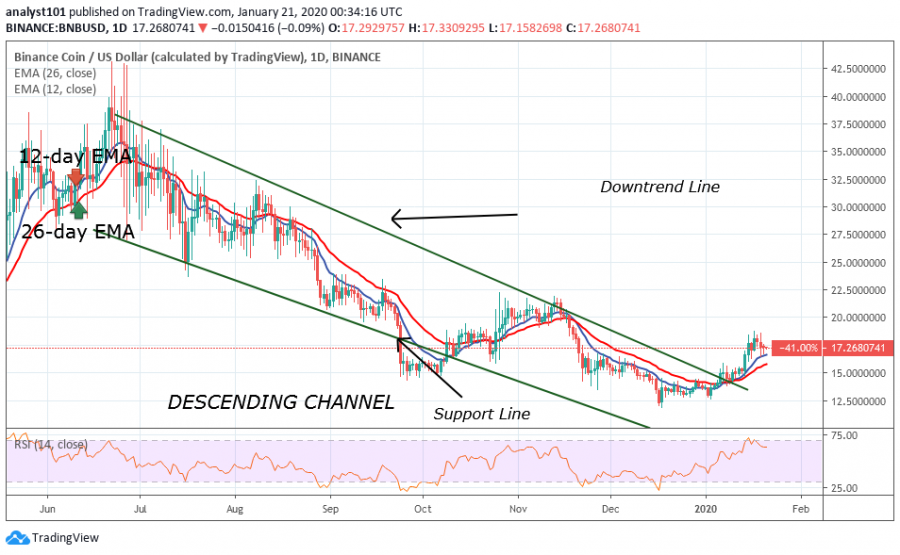
Binance Coin is in a bull market. After successfully breaking the downtrend line, the market reached a high of $18 but was resisted. The bulls were unable to penetrate the resistance level as the buying dries up. Nonetheless, the Relative Strength Index indicates that the market was overbought at $18. Sellers came in now to resume selling. The price bars have fallen to the support of the 12-day EMA. Binance Coin will readily commence a range-bound movement if the support holds. Alternatively, a retest at the resistance level is probable.
ADA/USD Major Trend: Bullish
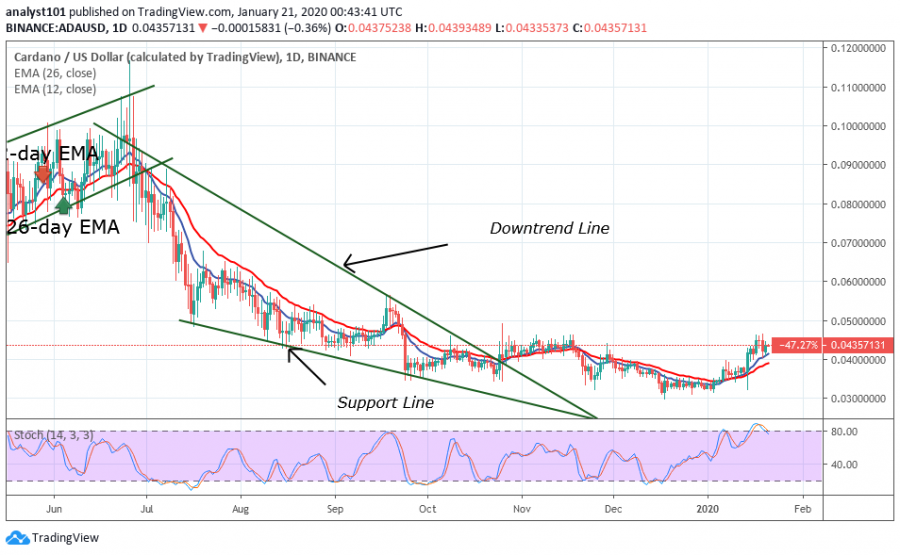
In the last 48 hours, Cardano traded and reached a high of $0.045. Today, after testing the $0.045 price level twice, the coin commenced a downward move. Nonetheless, in September 2019, after the last bearish impulse, the coin has not traded above the $0.045 price level. Rather, the price has been fluctuating between the low of $0.030 and $0.045. The range-bound movement will continue until the bulls break the resistance at $0.045. Meanwhile, the selling pressure will continue as the stochastic is showing signs that the market is overbought.
TRX/USD Major Trend: Ranging
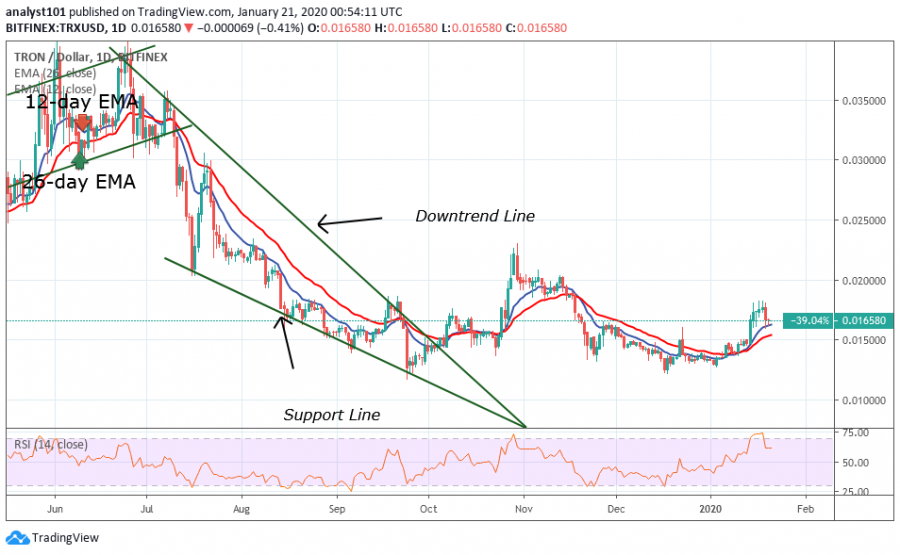
TRON has been range-bound at the bottom of the chart since September 2019. The coin has tested the low of $0.012 in September and December but fluctuates above the support at different price levels. Presently, the coin is retracing after testing the resistance at $0.018. The coin fell to the support above the 12-day EMA. The price will rise if the support holds to retest the $0.018 and $0.020 resistance levels. The range-bound movement will continue if these resistance levels remain intact. TRON upward move has been hampered because of a lack of buying power at a higher price level.
IOTA/USD Major Trend: Bearish
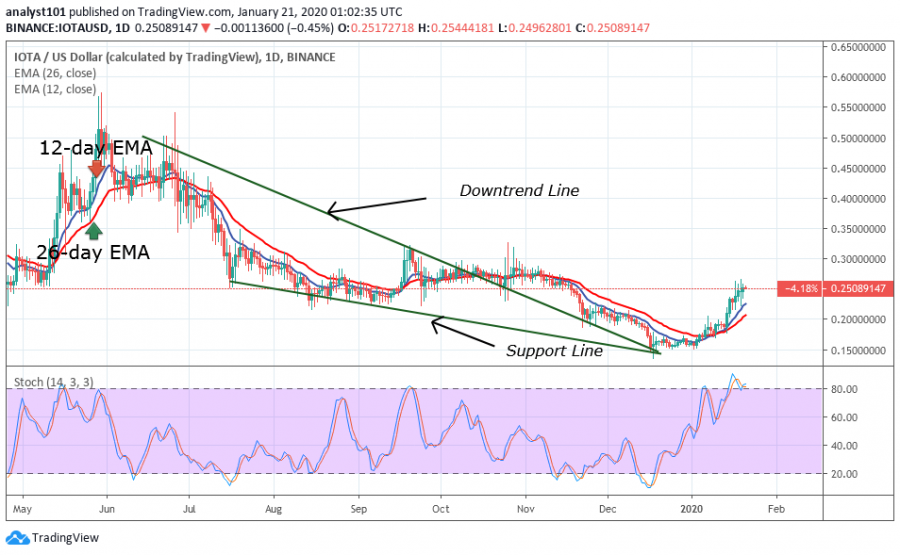
IOTA has been in a bear market since July 2019. The coin fell to the low at $0.0025 in December and commenced consolidation above $0.0025 for three weeks. The coin is currently in a bullish trend as it reached a high of $0.0037. The price breaks the downtrend line to reach the current high. MIOTA is presumed to have reversed since it breaks the downtrend line and the price closes above it. Meanwhile, the coin is rising as it faces resistance at $0.0040
HOT/USD Major Trend: Ranging
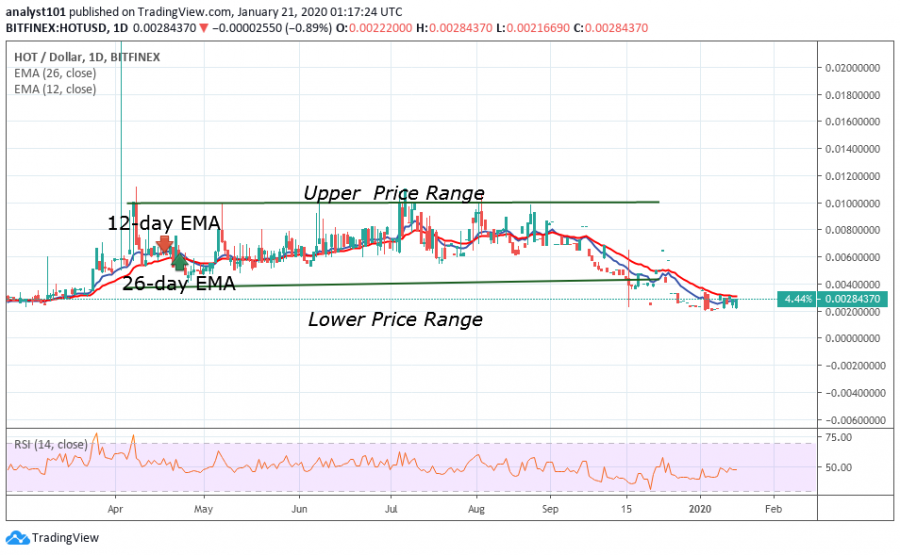
HOT has been in a sideways trend since April 2019. The coin fluctuates between $0.004 and $0.010. HOT is currently trading above the law of $0.002 support. In retrospect, the bulls have made concerted efforts to break the resistance at $0.010 on four occasions without success. The inability of the coin to break the resistance at $0.010 led the coin to fall to the low of $0.0020. The RSI period 14 level 44 indicates that price is in a sideways trend.
Disclaimer. This analysis and forecast are the personal opinions of the author are not a recommendation to buy or sell cryptocurrency and should not be viewed as an endorsement by CoinIdol. Readers should do their own research before investing funds.
Price
Price
Coin expert
Price
Price

(0 comments)