Chainlink Reaches Overbought Regions And Could Be Rejected At $7.30

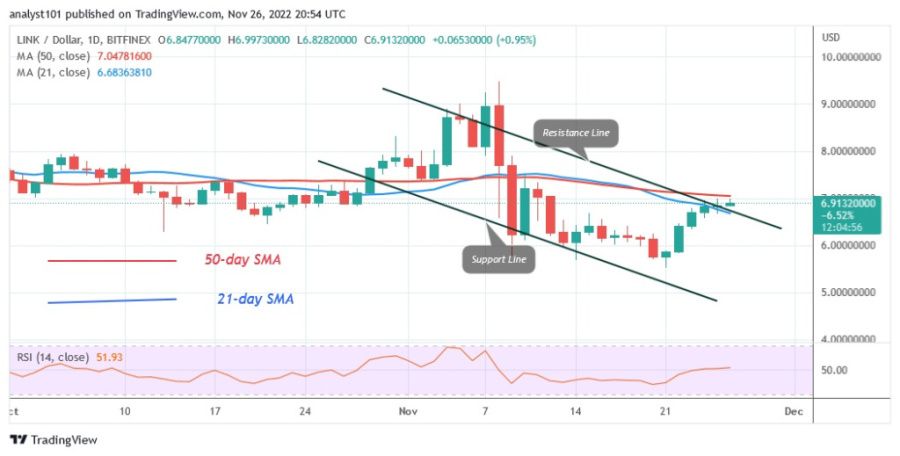
Chainlink (LINK) price is falling but correcting upwards. While approaching the 50-day line SMA, the cryptocurrency price has risen above the 21-day line SMA.
Chainlink price long-term analysis: bearish
At the time of writing, the price of LINK is currently trading at $6.94. If buyers manage to keep the price above the 50-day line SMA, the uptrend will gain momentum. If the cryptocurrency price breaks the moving average lines and the positive momentum continues, it will rise and retest the resistance at $9.48. On the other hand, if the buyers fail to keep the price above the 50-day line SMA, Chainlink will be forced to trade in a range between the moving average lines.
Chainlink indicator display
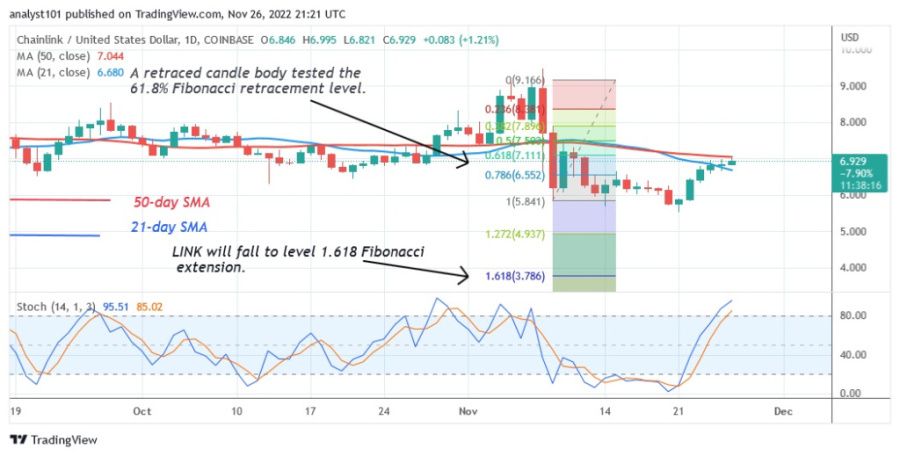
Chainlink's Relative Strength Index is at 52 for the 14 period, and the altcoin may continue to gain as it has now entered the uptrend zone. However, the price bars are between the moving average lines, suggesting that the cryptocurrency could move sideways. The daily stochastic for Chainlink is above 80, indicating that the overbought zone has been reached in the current rally.

Technical indicators
Key resistance levels - $30 and $35
Key support levels - $10 and $5
What is the next move for Chainlink?
At the point Chainlink enters the overbought area of the market, it is in an upward correction. When sellers enter the overbought area, the bullish momentum is likely to slow down. If the cryptocurrency reaches bullish exhaustion, it will likely fall. If it falls below the $5.77 support, the downtrend will resume. Otherwise, the price range between $5.77 and $7.50 will see another round of sideways movement.

Disclaimer. This analysis and forecast are the personal opinions of the author and are not a recommendation to buy or sell cryptocurrency and should not be viewed as an endorsement by Coin Idol. Readers should do their own research before investing in funds.
Price
News
Price
Price
Price

(0 comments)