Chainlink Is In Potential Decline And Approaching $6 High

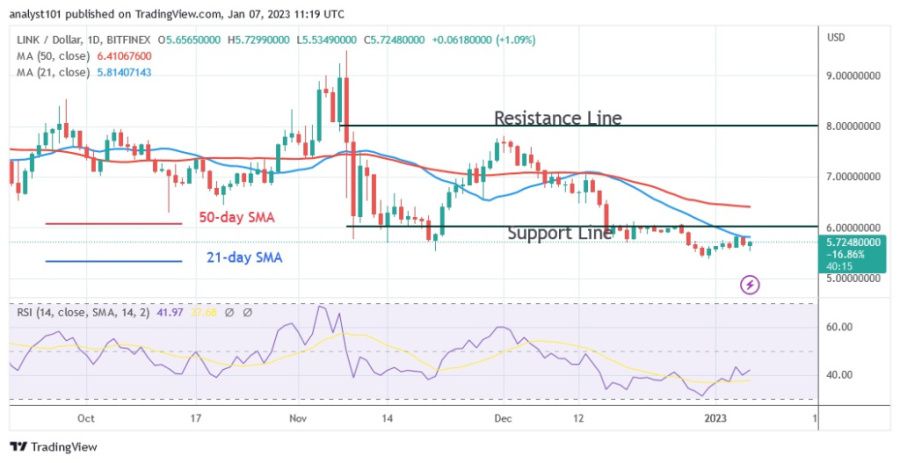
Chainlink (LINK) price has risen above the $5.77 support level, but was not able to surpass the 21-day line SMA. There is a risk that the altcoin will fall if it tries to break above the 21-day line SMA.
Chainlink price long-term analysis: bearish
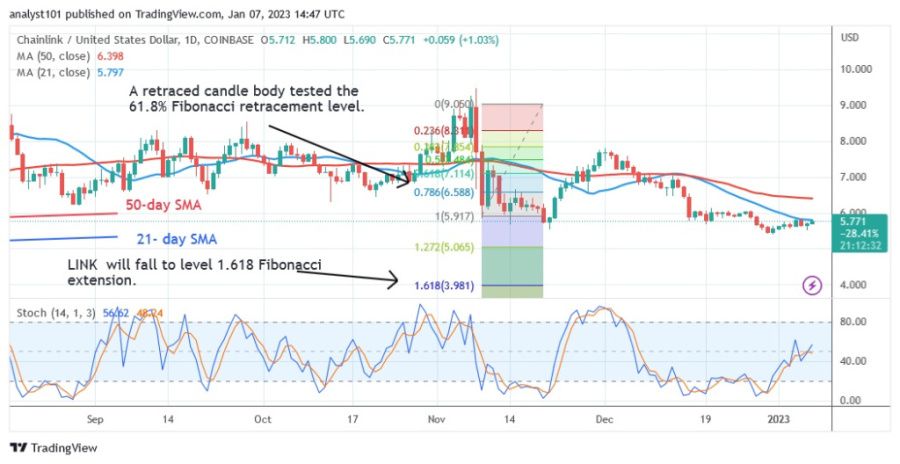
After Chainlink approached the moving average lines on December 30 and the price fell to a low of $5.42, it started to rise again. Buyers have been aggressive in staying above the moving average lines. On the positive side, Chainlink will rise to its previous high of $8.00 if the cryptocurrency's price rises above the moving average lines or resistance at $6.00. On the downside, the altcoin will continue to fall until it reaches a low of $3.92 or $4.00, where the moving average lines will reject it.
Chainlink indicator display
For the period 14, Chainlink's Relative Strength Index is at 39. LINK 's price has risen due to the recent upward movement. Nevertheless, the altcoin is in a bearish trend zone and may continue to decline. The moving average line is below the price bars, indicating a possible decline. The cryptocurrency is in an uptrend when the daily stochastic is above the 40 level.

Technical indicators:
Key resistance levels - $30 and $35
Key support levels - $10 and $5
What is the next step for Chainlink?
Chainlink is approaching another potential decline as it faces rejection at the $6.00 high. The current system has already proven ineffective. The moving average lines are rejecting the upside correction. According to the Fibonacci tool, the altcoin will continue to fall. Selling pressure will increase to $3.98 if the current support is broken.

Disclaimer. This analysis and forecast are the personal opinions of the author and are not a recommendation to buy or sell cryptocurrency and should not be viewed as an endorsement by Coin Idol. Readers should do their own research before investing in funds.
Price
Price
Price
Price
Price

(0 comments)