Cardano Slides Above Its Initial Barrier And Aims Up Of $0.50

The price of Cardano (ADA) has resumed its uptrend above the 21-day moving average line as it enters the oversold territory.
Long-term outlook for Cardano price: bearish
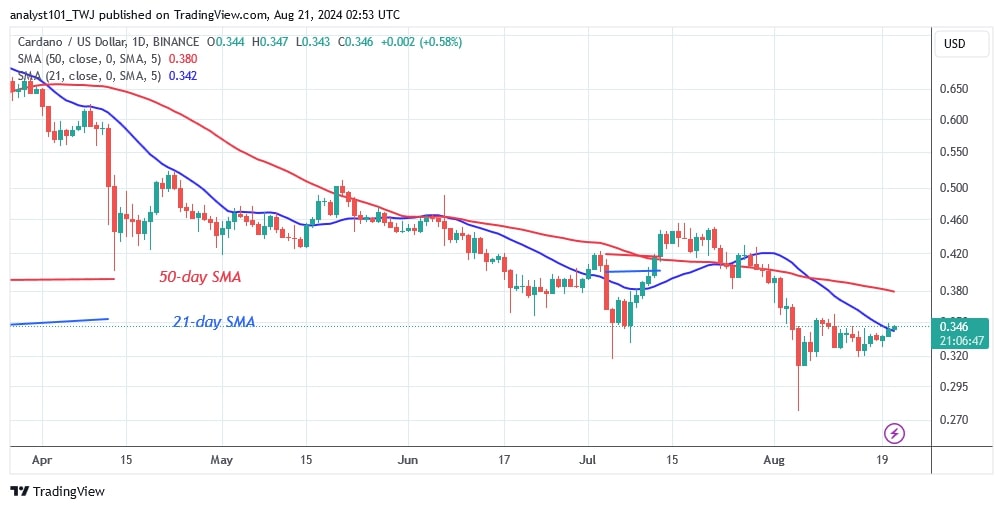
On the daily chart, buyers have kept the price above the 21-day SMA, suggesting that the cryptocurrency could head upward. The buyers will try to push the altcoin to the top of the 50-day SMA, which is at $0.38. However, if the bulls break above the 50-day SMA, the altcoin will rise to $0.50.
Cardano, on the other hand, will remain trapped between the moving average lines for a few days if the buyers fail to sustain the upside momentum above the 50-day moving average line. This causes the cryptocurrency to oscillate between the moving average lines.
On the negative side, further declines in the altcoin are unlikely as the downtrend ends. Cardano is currently worth $0.34.
Analysis of the ADA indicator
On the daily chart, the price bars are between the moving average lines as the altcoin is recovering above the 21-day SMA resistance. Buyers have broken through the resistance at the 21-day SMA, signaling the start of an uptrend.
In the recent price action, the moving average lines were breached but the ADA price was rejected at the $0.46 resistance zone. The price of Cardano will rise if it breaks above the high of $0.46.
Technical Indicators
Key Resistance Zones: $0.80, $0.85, and $0.90
Key Support Zones: $0.50, $0.45, and $0.40

What is the next move for ADA?
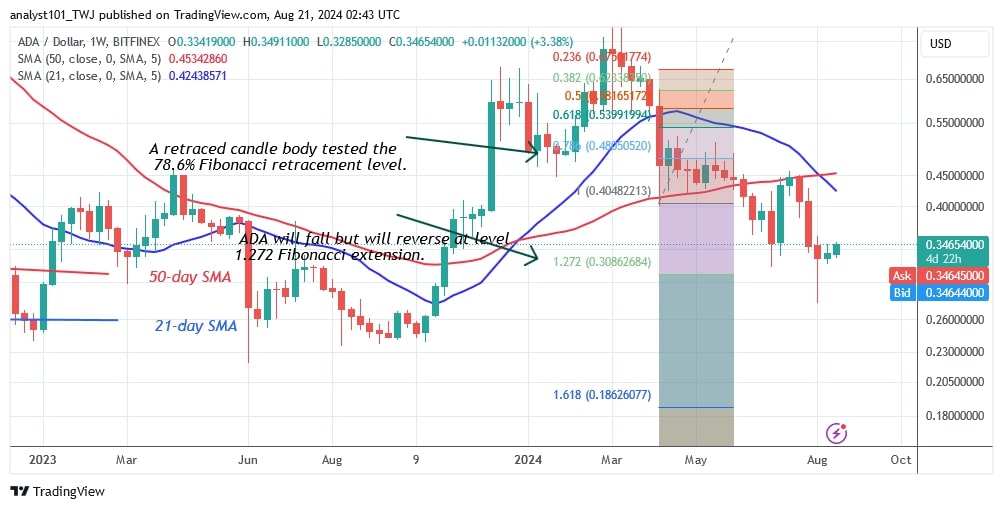
The Cardano price has broken through its trading range and has been driven above the 21-day SMA barrier by buyers. Since August 5, the altcoin has been fluctuating between the $0.32 support and the 21-day SMA high, as reported previously by Coinidol.com. The uptrend has started as the altcoin price has risen above the 21-day moving average line. The uptrend will resume once it breaks above the 50-day SMA.

Disclaimer. This analysis and forecast are the personal opinions of the author. They are not a recommendation to buy or sell cryptocurrency and should not be viewed as an endorsement by CoinIdol.com. Readers should do their research before investing in funds.
Price
Coin expert
Price
News
Coin expert

(0 comments)