Bitcoin Overcoming the Resistance at $10,800 Suggests Further Upside Is Imminent

Bitcoin (BTC) price analysis, September 28, 2020. Bitcoin bulls have broken the $10,800 high to retest the $11,000 resistance. The retest faces immediate rejection as the coin retraces.
Bitcoin Price Long-Term Prediction: Bullish
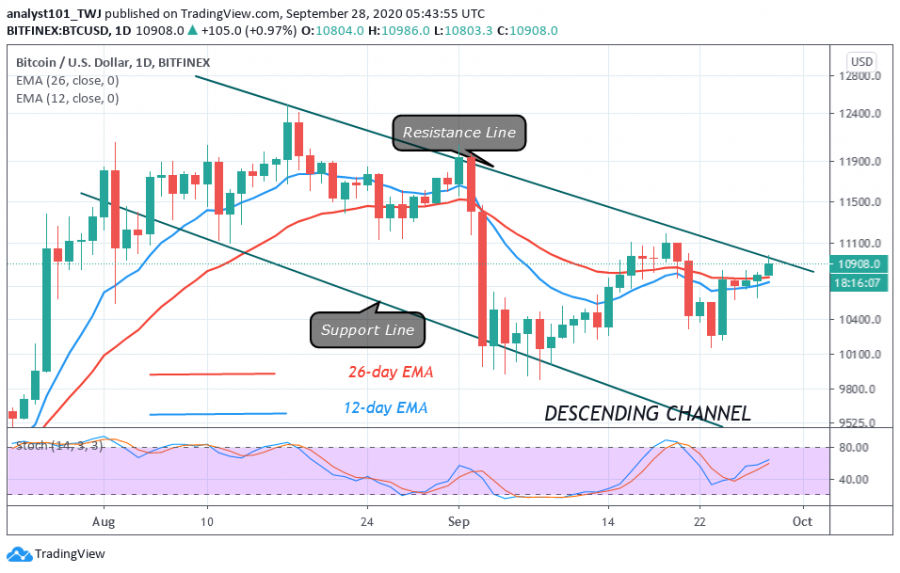
The bulls are yet to achieve any meaningful progress as subsequent resistances from $11,000 to $11,300 have to be cleared before attempting to break the $12,000 and $12,400 overhead resistances. At the moment, the BTC price is retracing after retesting the $11,000 resistance. The price may fall into the range-bound zone and then initiate a fresh uptrend. The range-bound zone is between $10,580 and $10,800 where the BTC price has been consolidating to break the $10,800 resistance.
On the upside, if the $10,800 resistance is convincingly broken, BTC will rally above $11,100. A breakout above $11,100 will clear the resistances at $11,200 and $11,300. BTC price will now have an accelerated price movement to retest the $12,000 high. However, this bullish scenario will be invalidated if the bulls fail to push the price to previous highs. The bears will use that advantage to push the price below the $10,700 or $10,580 support levels. This will negatively affect the uptrend.
Bitcoin Indicator Reading
BTC price has broken above the EMAs which suggests a further rise of the coin. The market will continue to rise as long as the price is above the EMAs. The coin is also in a bullish momentum above the 50% range of the daily stochastic. The EMAs are sloping northward indicating the uptrend.

Key Resistance Zones: $10,000, $11,000, $12,000
Key Support Zones: $7,000, $6,000, $5,000
What Is the Next Direction for BTC/USD?
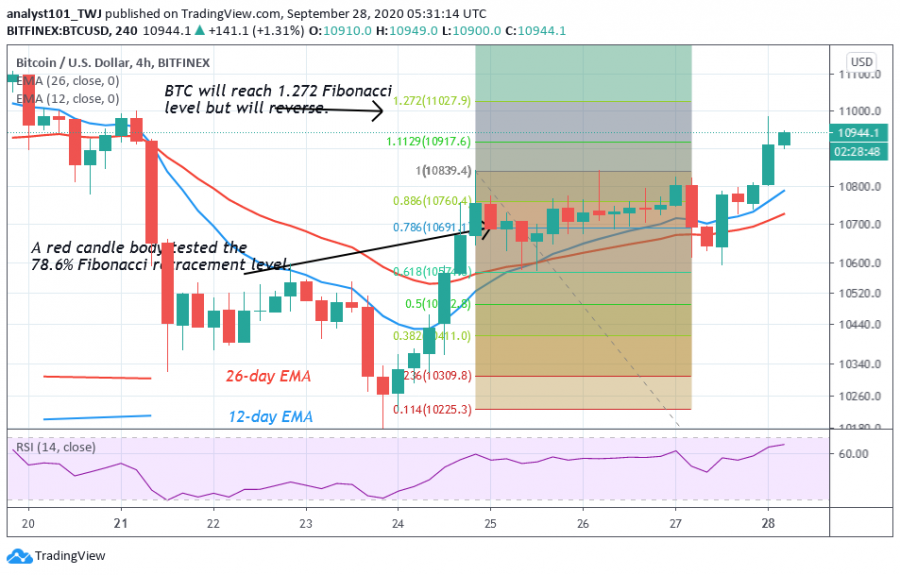
Bitcoin is likely to make a further upward move once the resistances at $10,800 and $11,000 are breached. On the September 24 uptrend, the retraced candle body tested the 78.6 % Fibonacci retracement level. This indicates that BTC will reach a high of 1.272 Fibonacci extensions or $11,027.90 high. However, at the recent high, BTC is likely to face selling pressure and may fall.

Disclaimer. This analysis and forecast are the personal opinions of the author and not a recommendation to buy or sell cryptocurrency and should not be viewed as an endorsement by CoinIdol. Readers should do their own research before investing funds.
Coin expert
Price
Price
Price
News

(0 comments)