Bitcoin Holds Above $40,000 Support As Buyers Show Up In Oversold Region

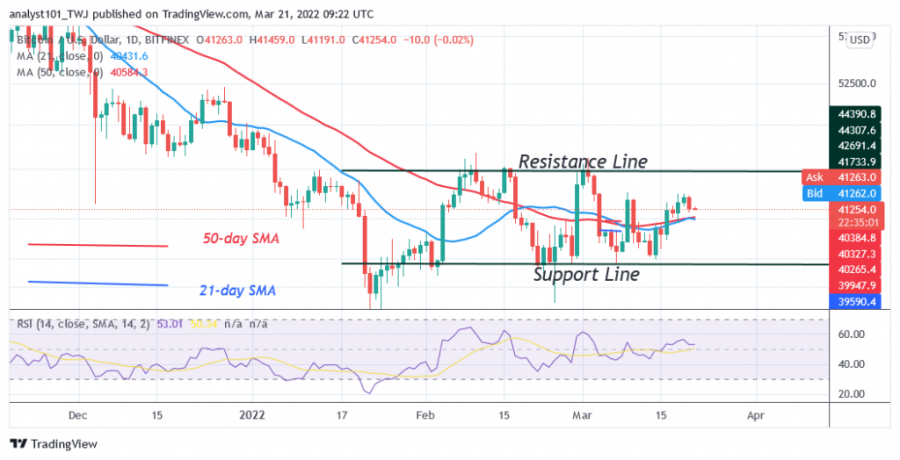
The price of Bitcoin (BTC) has dropped and fallen above the moving averages. In other words, it has fallen above the psychological price level of $40,000.
Bitcoin (BTC) price long term forecast: bullish
Since March 9, buyers have failed to overcome the $42,000 resistance zone. The uptrend was staved off twice at the resistance zone. Bitcoin could have rallied to the upper resistance of $45,000 if the bulls had overcome this resistance. Unfortunately, the bears pushed Bitcoin above the $40,000 price level.
If the bears fall below the moving averages, the downtrend will accelerate. The BTC price will fall to a low of $37,000. On the other hand, if the BTC price declines and finds support above the moving averages, a new uptrend will likely begin. BTC/USD will be forced to trade between $37,000 and $42,427.
Bitcoin (BTC) indicator reading
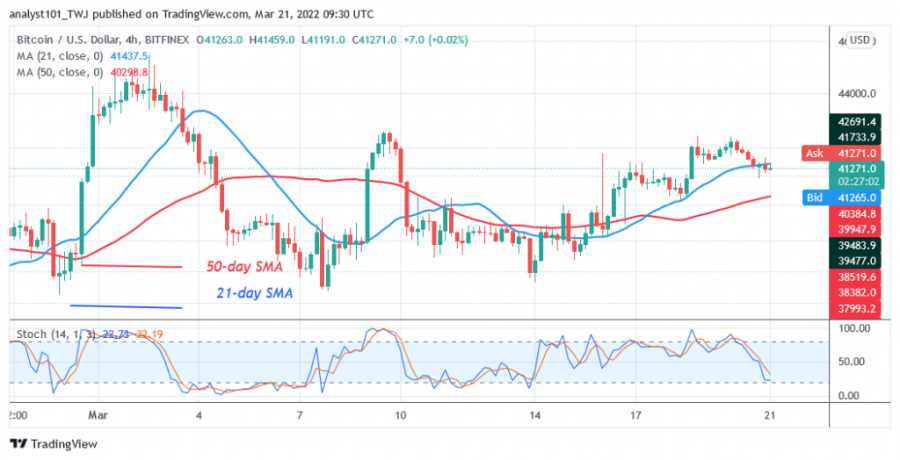
Bitcoin is at level 51 of the Relative Strength Index for period 14, indicating that there is a balance between supply and demand. The 12-day line SMA and the 50-day line are inclined horizontally, indicating a sideways movement. Bitcoin is below the 20% range of the daily stochastic. The largest cryptocurrency has fallen into the oversold zone of the market. The current selling pressure is likely to ease as buyers emerge in the oversold region.

Technical indicators:
Major Resistance Levels – $65,000 and $70,000
Major Support Levels – $60,000 and $55,000
What is the next direction for BTC/USD?
On the 4-hour chart, BTC/USD is in a sideways movement. After reaching the $42,000 resistance zone, the cryptocurrency retreated and fell between the moving averages. The cryptocurrency is above the 50-day moving average, but below the 21-day moving average. This indicates that the market will move in a fluctuation range.

Disclaimer. This analysis and forecast are the personal opinions of the author are not a recommendation to buy or sell cryptocurrency and should not be viewed as an endorsement by CoinIdol. Readers should do their own research before investing funds.
Price
Price
Price
Price
Price

(0 comments)