BNB Maintains Its Range Bond Move And Stabilizes Above $230
Updated: Aug 04, 2023 at 14:41

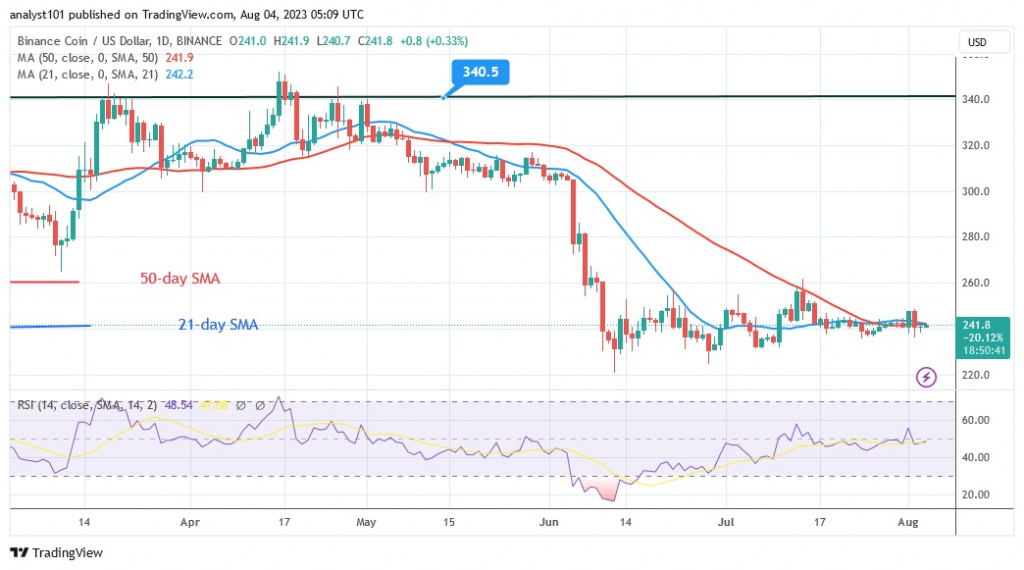
BNB has been fluctuating in a range since the price collapse on June 12. The cryptocurrency asset has traded between $220 and $260.
BNB price long term forecast: fluctuation range
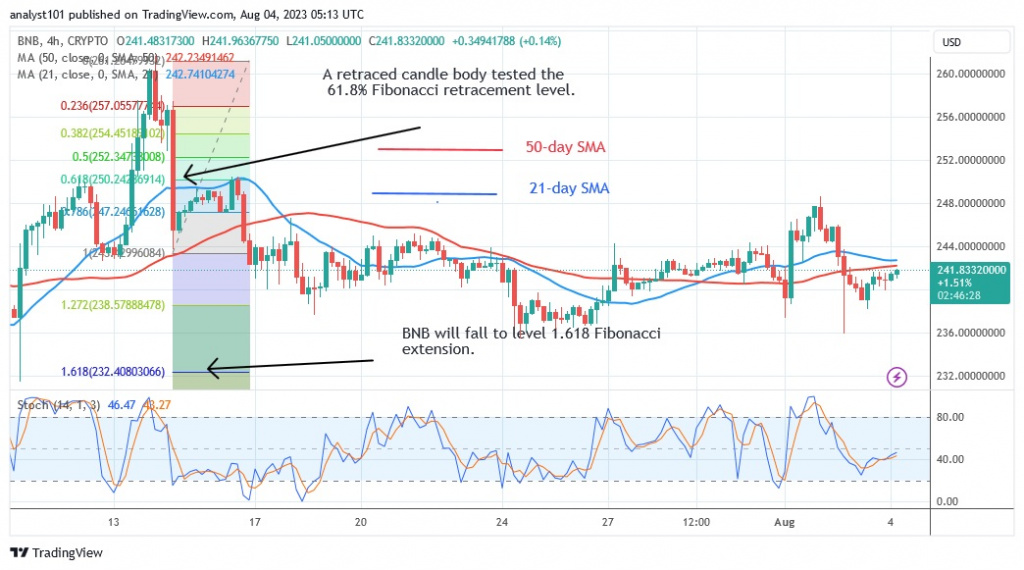
However, the price change was limited to the price range of $230 to $250. The price of BNB corrected upwards on August 1 and was rejected at the high of $247. On August 2, it fell to a low of $236.
The price has been moving in this manner since July 16. The appearance of doji candlesticks has limited the price movement both up and down. At the time of writing, BNB is trading at $242.10.
BNB indicator display
The price of BNB is stabilizing at the 49 level of the Relative Strength Index for the 14-month period. This shows that supply and demand have reached an equilibrium point. The price bars oscillate below and above the moving average lines. The altcoin is currently in an uptrend above the daily stochastic threshold of 40.

Technical Indicators:
Key resistance levels – $300, $350, $400
Key support levels – $200, $150, $100
What is the next direction for BNB/USD?
Doji candlesticks are in place and BNB is expected to continue moving within its range. It is currently trading above the lowest price range. If the $242 high or the moving average lines are rejected, the decline could resume.

Disclaimer. This analysis and forecast are the personal opinions of the author and are not a recommendation to buy or sell cryptocurrency and should not be viewed as an endorsement by CoinIdol.com. Readers should do their research before investing in funds.
Price
Price
Price
Price
News

(0 comments)