BNB Stabilises Above $580 In Anticipation Of An Uptrend

Binance (BNB) coin price is trading modestly due to its horizontal trend. Price analysis by Coinidol.com.
Long-term forecast for the BNB price: fluctuating
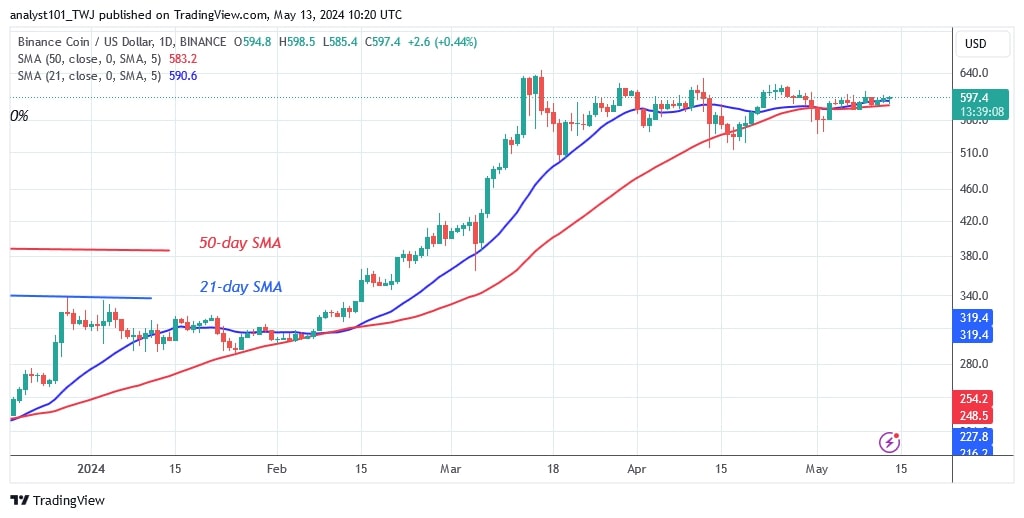
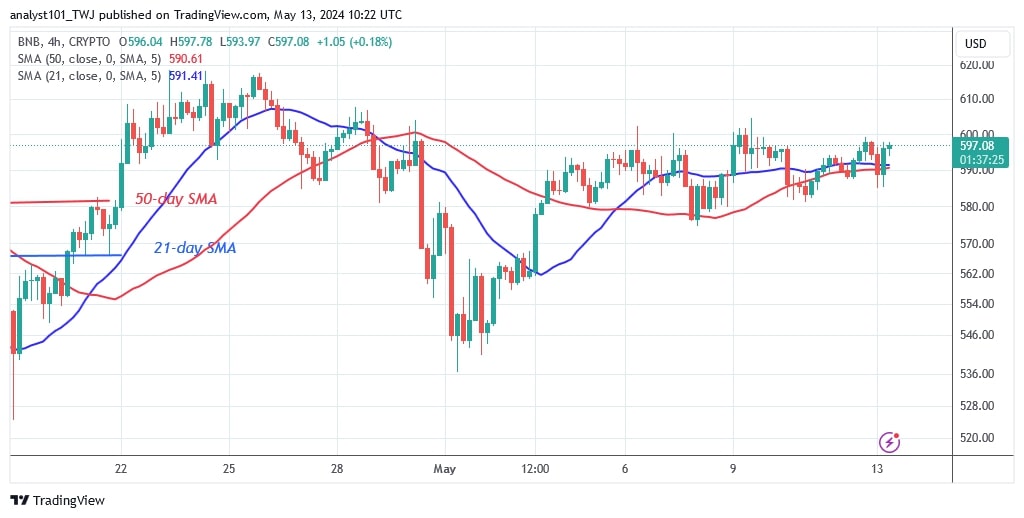
Since May 5, the altcoin's price has been confined to a narrow band of $580 to $600. Over the past week, the formation of indecisive small-bodied candles has kept the BNB price above $590. Today, the altcoin is trading at $595.50 above its moving average lines.
If the altcoin moves higher, it will break through the upper resistance of $635. On the other hand, if the bears break below the moving average lines, BNB would fall to a low of $520.
BNB indicator reading
The price of the cryptocurrency is consolidating above the moving average lines on both charts. The appearance of doji candlesticks casts doubt on the altcoin's potential rise. On the 4-hour chart, long candlestick wicks indicate higher price levels. This indicates strong selling pressure at higher levels.
Technical indicators:
Key resistance levels – $600, $650, $700
Key support levels – $400, $350, $300

What is the next direction for BNB/USD?
The cryptocurrency is consolidating within a range. It is trading in a narrow range above the $580 support. BNB is expected to rise again as the price bars are above the moving average lines. Currently, the altcoin is consolidating ahead of a positive trend.

Disclaimer. This analysis and forecast are the personal opinions of the author and are not a recommendation to buy or sell cryptocurrency and should not be viewed as an endorsement by CoinIdol.com. Readers should do their research before investing in funds.
Price
Price
News
News
Price

(0 comments)