BNB Recovers And Breaks Through The Initial Barrier Of $545

BNB (BNB) has recovered from the July 5 drop. BNB coin analysis by Coinidol.com.
BNB price long-term trend: bearish
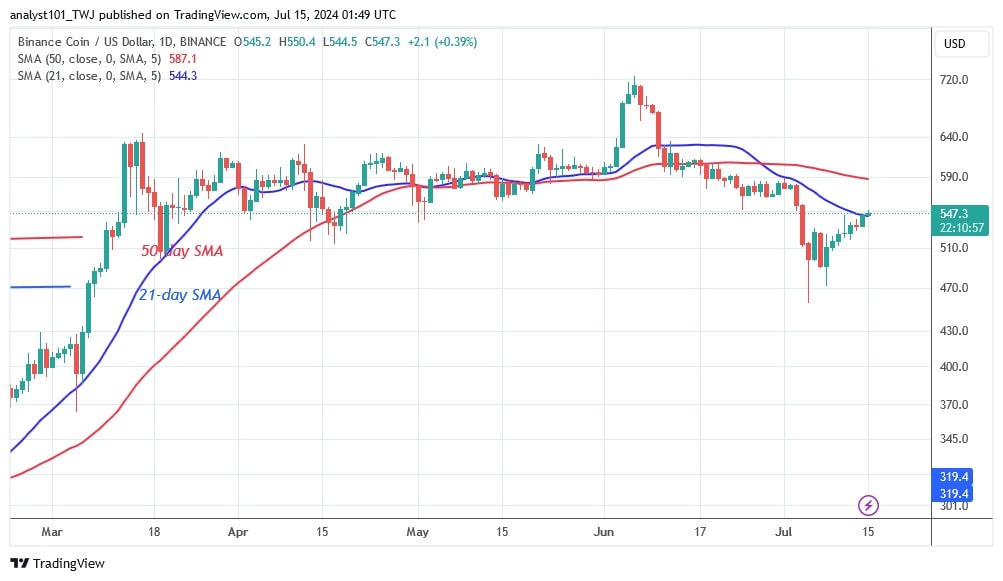
On July 5, BNB fell to a low of $455.20 and then recovered. Since July 8, BNB has continued its uptrend and has risen to a high at the 21-day SMA or $545. The bulls are still struggling to keep the price above the 21-day moving average. Once the price of the cryptocurrency breaks above the 21-day SMA, it will resume its uptrend. The positive momentum will continue until it reaches the 50-day SMA high or $590.
However, the bullish scenario will become meaningless if the altcoin is rejected at the 21-day SMA. The cryptocurrency will decline and remain range-bound above the $470 support but below the 21-day moving averages. BNB/USD is now worth $546.
BNB indicator reading
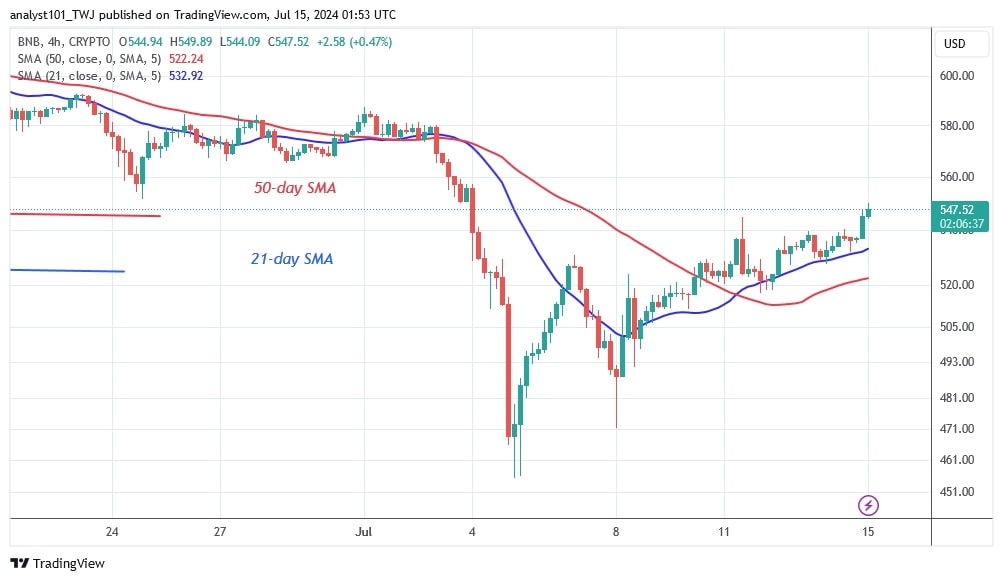
Following the rally, the price bars on the 4-hour chart have risen above the moving average lines.
On the daily chart, the price bars are below the moving average lines but not below the 21-day SMA. The uptrend is being held back by resistance at $545 or the 21-day SMA. A break above the 21-day SMA will cause the cryptocurrency to rise.
Technical indicators:
Key resistance levels – $600, $650, $700
Key support levels – $400, $350, $300

What is the next direction for BNB/USD?
BNB has recovered from its downtrend, with the price bars breaking above the moving average lines on the 4-hour chart. The price of the altcoin has been trading above the moving averages but below the high of $540. On July 14, the price of the cryptocurrency rebounded and surpassed the high of $540. Resistance at $545 has slowed down the cryptocurrency's uptrend.

Coinidol.com reported previously that on July 1, the bulls failed to sustain the price above the 21-day SMA, leading to a further decline in the cryptocurrency. The bears broke through the current support at $551 and reached another low of $454.
Disclaimer. This analysis and forecast are the personal opinions of the author. They are not a recommendation to buy or sell cryptocurrency and should not be viewed as an endorsement by CoinIdol.com. Readers should do their research before investing in funds.
Price
News
Price
Price
News

(0 comments)