BNB Reaches $590 And Moves Within Its Range
Updated: Oct 15, 2024 at 18:03

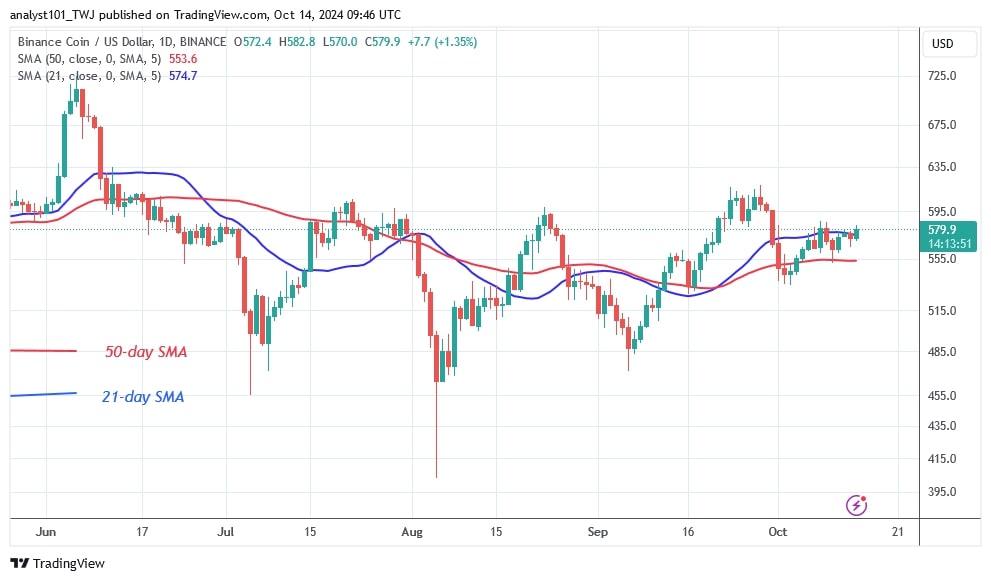
The price of Binance coin or BNB (BNB) has been stuck between the moving average lines since October 5. However, buyers have been desperately trying to keep the price above the moving average lines.
Long-term BNB price forecast: bullish
On October 9, the 21-day SMA reversed the bullish momentum. Today, the price of the cryptocurrency is rising and trying to break above the 21-day SMA barrier. If the buyers are successful, BNB will reach a high of $600. Buyers have failed to sustain the positive momentum above $600 since July 22.
On the other hand, if BNB is rejected at its recent high, it will fall below the 21-day SMA.
On the other hand, if BNB is rejected at its recent high, it falls below the 21-day SMA. Today BNB rises and reaches a high of $581.
BNB indicator reading
The price of BNB has partially broken above the resistance line of the 21-day SMA. In addition, the price bars are above the moving average lines, indicating that the cryptocurrency will continue to rise. The moving average lines are horizontal as the altcoin remains in a price range of $480 to $600.
Technical indicators:
Resistance Levels – $600, $650, $700
Support Levels – $400, $350, $300

What is the next direction for BNB/USD?
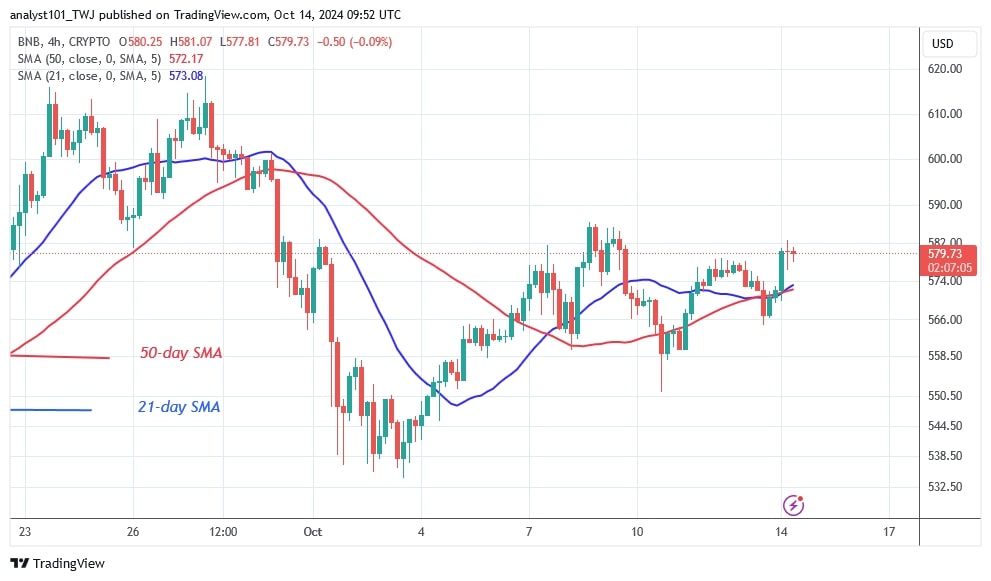
On the 4-hour chart, BNB is correcting higher after breaking above the moving average lines. Since October 8, the uptrend has stalled below the $580 resistance. BNB is currently trading within a narrow range of $560 to $590. The formation of doji candlesticks has led to a halt in the price movement.

Disclaimer. This analysis and forecast are the personal opinions of the author. They are not a recommendation to buy or sell cryptocurrency and should not be viewed as an endorsement by CoinIdol.com. Readers should do their research before investing in funds.
News
Coin expert
Price
Price
News

(0 comments)