BNB Price Recovers But Encounters Resistance At $600
Updated: Sep 21, 2024 at 18:18

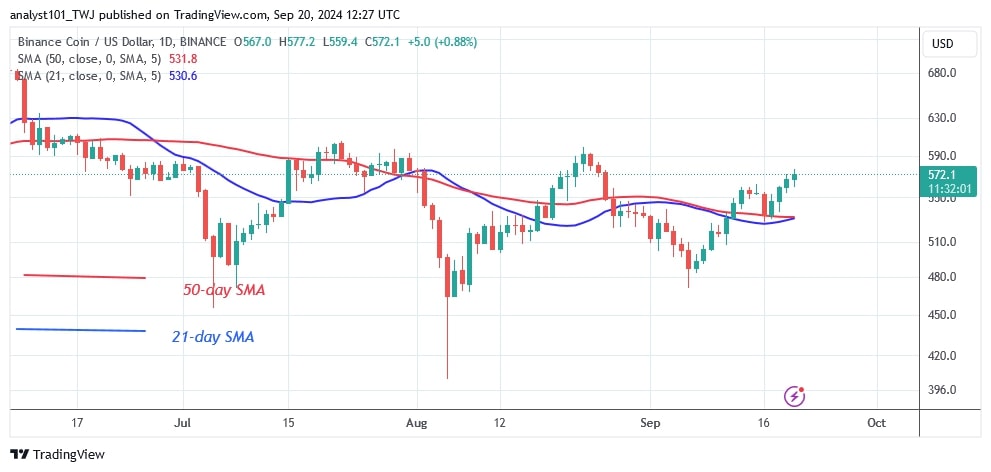
The price of Binance coin (BNB) is in an upward correction after rising above the moving average lines. The cryptocurrency value is moving sideways as it rises above the moving average line.
BNB price long term forecast: ranging
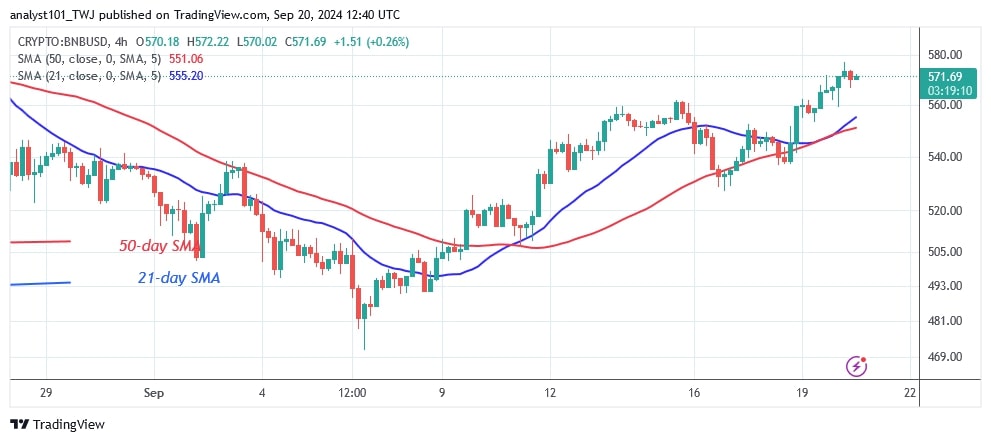
The bullish momentum reached a high of $559.80 before pulling back and retesting the moving average lines. Positive momentum is expected to continue to the $600 high. Since July 21, the uptrend has reversed after reaching $600. BNB will rise to a high of $720 if the current resistance is broken. BNB is currently trading at $567.20.
BNB price indicator reading
After the price comeback, the price bars have moved above the moving average lines, indicating that the cryptocurrency is rising. The price movement is characterised by doji candlesticks, which slow down the price movement. The moving average lines are horizontal, indicating that a sideways trend started in March.
Technical indicators:
Resistance Levels – $600, $650, $700
Support Levels – $400, $350, $300

What is the next direction for BNB/USD?
After the price rise, BNB/USD is trading in an uptrend. The upward movement will continue if the bulls overcome the resistance at $600. However, the altcoin could face resistance at the high of $600. The upper resistance has not been broken since July 21. The current bullish momentum is stuck at the $580 high.

Disclaimer. This analysis and forecast are the personal opinions of the author. They are not a recommendation to buy or sell cryptocurrency and should not be viewed as an endorsement by CoinIdol.com. Readers should do their research before investing in funds.
Price
Price
Price
Price
Price

(0 comments)