

Bitcoin Surges Past $69,000: Decoding the Macro-Driven Crypto Breakout
Updated: Aug 20, 2026 at 18:30

The cryptocurrency landscape has undergone a dramatic shift, with Bitcoin surging past the $69,000 threshold to touch multi-month highs, powered by the latest market intelligence from CoinIdol.com.
Global macroeconomics continue to dictate the rhythm of digital assets. While the Federal Reserve kept interest rates steady at 3.50%–3.75%, the broader economic climate has been heavily influenced by shifting liquidity expectations and labor market cooling.
According to the latest market intelligence analysis from Coinidol.com, the primary catalyst for the recent market explosion arrived from U.S. Treasury adjustments, specifically plans to double long-dated bond buybacks from $2 billion to at least $4 billion per operation starting September 9, 2026.
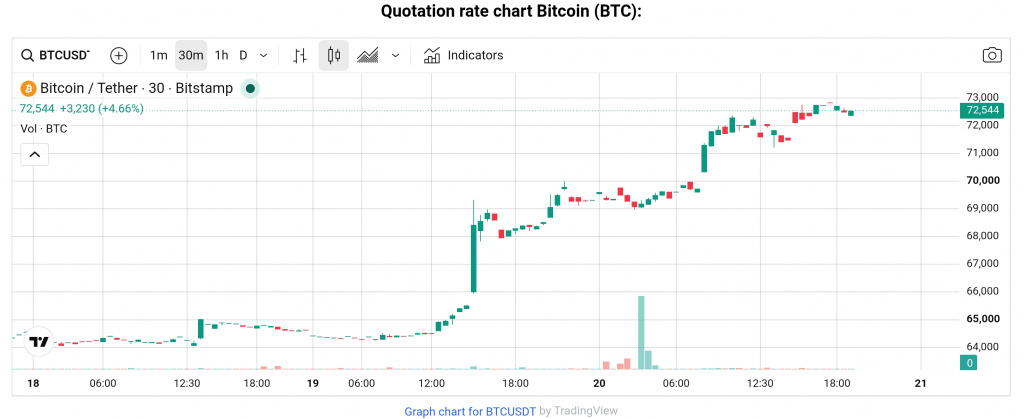
This major liquidity injection lower down the yield curve triggered a massive risk-on rotation. Consequently, Bitcoin price analysis highlights that BTC shattered multi-month resistance ranges, supported by a weakening U.S. dollar index and falling Treasury yields.
Coinidol.com reported that on August 19, BTC price moved above the moving average lines and reached $69,000. Furthermore, the price continues its bullish rally on August 20:
Regulatory Clarity and Blockchain Architecture
The regulatory landscape is entering a critical maturity phase. Industry leaders and institutional participants are closely monitoring upcoming legislative milestones, such as discussions surrounding the delayed CLARITY Act, which heavily dictates long-term institutional appetite.
Simultaneously, leading blockchain networks are adapting to higher-throughput demands. Ethereum continue to optimize its execution architectures, capturing institutional traffic and real-world asset (RWA) tokenization utility. This structural upgrades cycle separates foundational network utility from pure retail speculation, strengthening the market's long-term infrastructure.
Liquidation Cascades and Supply Dynamics
Underneath the surface price movement, on-chain data reveals a market fueled by a potent mix of short-covering and structural supply shifts. The sudden macro-driven price expansion triggered a massive cascade, wiping out more than $1 billion in leveraged short positions within a 24-hour window.
Recent chain data indicates that long-term holders have actively managed supply, with coins held longer than a year shifting down by roughly 2.9% as seasoned investors reallocate capital.
However, despite massive derivatives liquidations, underlying spot volume has historically remained selective, signaling that spot market participants are demanding sustainable macro confirmation before full-scale accumulation.
Scenarios for the Coming Week
As the market digests these multi-month highs, traders should prepare for heightened volatility heading into late August.
Bullish Continuation Scenario
If Bitcoin successfully holds structural support above the newly established breakout zone, institutional buying via spot ETFs could sustain upward pressure toward the $72,000 resistance ceiling.
Consolidation or Pullback Scenario
Given the speed of the recent liquidity-driven rally, a short-term cooling period or retest of lower support levels ($65,000–$67,000) is plausible as overheated leverage clears out.
Disclaimer. The data provided is collected by the author and is not sponsored by any company or token developer. This is not a recommendation to buy or sell cryptocurrency and should not be viewed as an endorsement by Coinidol.com. Readers should do their research before investing in funds. Brought from CoinIdol.com.
News
Price
News
Price
News

(0 comments)