Bitcoin in a Stalemate as It Struggles to Break Resistance at $18,600 and $18,800
Updated: Nov 23, 2020 at 12:07

On November 19, the bulls bought the dips as price rallied to $18,800 high. Bitcoin attained the recent high on November 21 but could not continue the upward move.
Presently, the king coin has slumped down to $17,800 but fluctuates between $17,800 and $18,600. For the king coin to resume upside momentum, the bulls have to break the resistance at $18,600 and $18,800. For the past three days, BTC is yet to trend as it consolidates within the range-bound zone.
Usually, Bitcoin has been trending within three days of correction. At the time of writing, Bitcoin is fluctuating within a confined range. There has been no indication of bullish signals. On the upside, if buyers can push the price above the $18,800 resistance, BTC is likely to rally above $19,200. However, where buyers fail to act, sellers will take advantage to break below the $17,800 support. This will sink the coin to either $17,400 or $16,600 low. Meanwhile, BTC is struggling in the range-bound zone to retest the resistance levels.
Bitcoin indicator reading
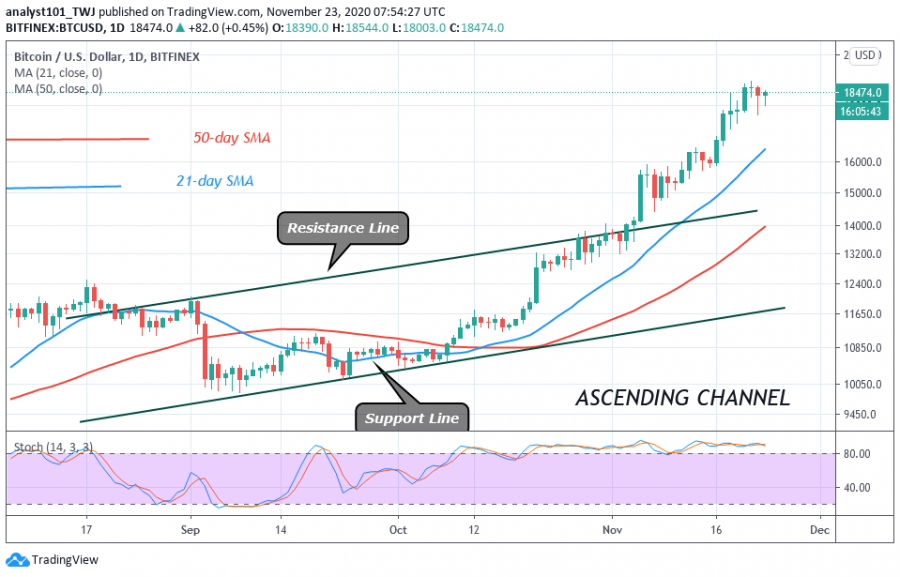
Bitcoin has been trading above the 80% range of the daily stochastic since October 10. This has contributed to the recent price surge as the bullish momentum has been sustained. The 21-day and 50-day SMAs are heading northward indicating that the market is in an upward move.

Key Resistance Zones: $13,000, $14,000, $15,000
Key Support Zones: $7, 000, $6, 000, $5,000
What is the next direction for BTC/USD?
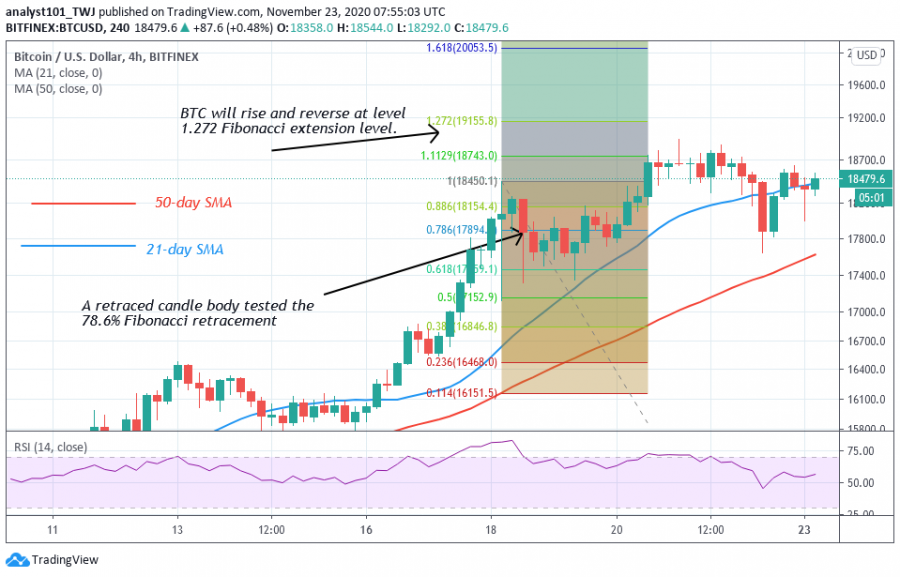
Bitcoin is expected to rise once the $18,600 and $18,800 resistance levels are breached. From the Fibonacci tool analysis, Bitcoin is expected to rise briefly and reverse. On November 18, a retraced candle body tested the 78.6% Fibonacci retracement level. This retracement indicates that the coin will rise and reverse at 1.272 Fibonacci extension level. That is the market will reverse at $19,155.80.

Disclaimer. This analysis and forecast are the personal opinions of the author that are not a recommendation to buy or sell cryptocurrency and should not be viewed as an endorsement by CoinIdol. Readers should do their own research before investing funds.
Price
News
Price
Price
Price

(0 comments)