Bitcoin Hovers above $9,700 at Vital Striking Distance

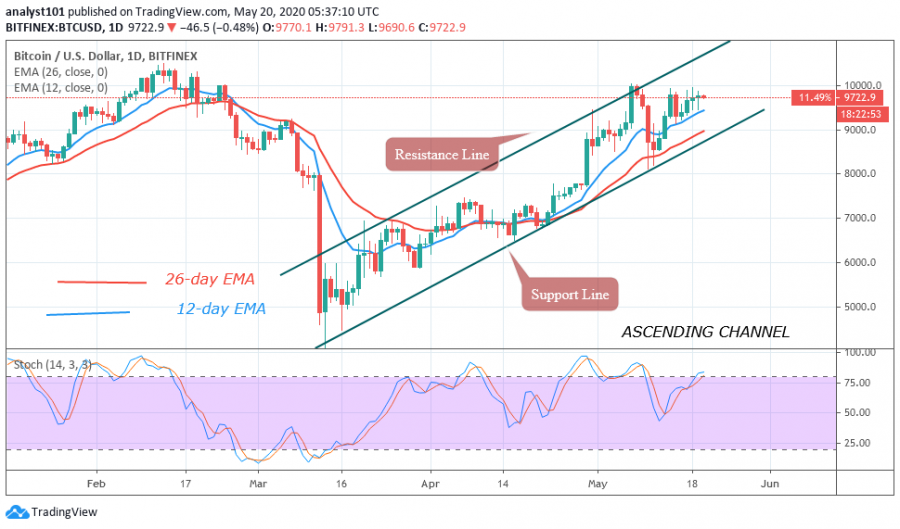
In the last three days, Bitcoin has been hovering above $9,700 after several attempts to break the $10,000 overhead resistance. Many analysts believe that several retests only produce a weakening effect over the $10,000 resistance zone.
On many occasions, buyers pushed BTC above the $10,000 benchmark but failed to sustain the uptrend. Others retest the resistance zone and were repelled. On May 17, the market became stable in the upside region between $9,300 and $10,000.
As prices retrace to $9,300 low, it becomes possible to retest the resistance zone. This has been the market scenario in the last few days. In the upside region, if BTC rebounds or a breakout occurs, price is likely to rally above $10,000 resistance, and the momentum will extend to the next support at $11,400. Meanwhile, the small body candlesticks in the last three days signify that buyers and sellers are undecided about the direction of the market.
Bitcoin indicator reading
The crypto is almost above the 80% range of the daily stochastic. That is the market is approaching the overbought region. When the coin is overbought, sellers will emerge to push prices downward. It invariably means that BTC is likely to drop. However, if it drops below $8,200 is an indication of a possible downward move.

Key Resistance Zones: $10,000, $11,000, $12,000
Key Support Zones: $7, 000, $6, 000, $5,000
What is the next direction for BTC/USD?
Since May 7, the journey to breach the $10,000 resistance has been ongoing. The bulls have achieved little success as the level has proved to be strong. Invariably it is the major resistance for Bitcoin. The price level is yet to be broken since August 2019.
Disclaimer. This analysis and forecast are the personal opinions of the author that are not a recommendation to buy or sell cryptocurrency and should not be viewed as an endorsement by CoinIdol. Readers should do their own research before investing funds.
Price
Price
Price
Price
Price

(0 comments)