Dogecoin Price Fluctuates Above $0.148 As Traders Become Hesitant
Updated: Jun 10, 2024 at 12:13

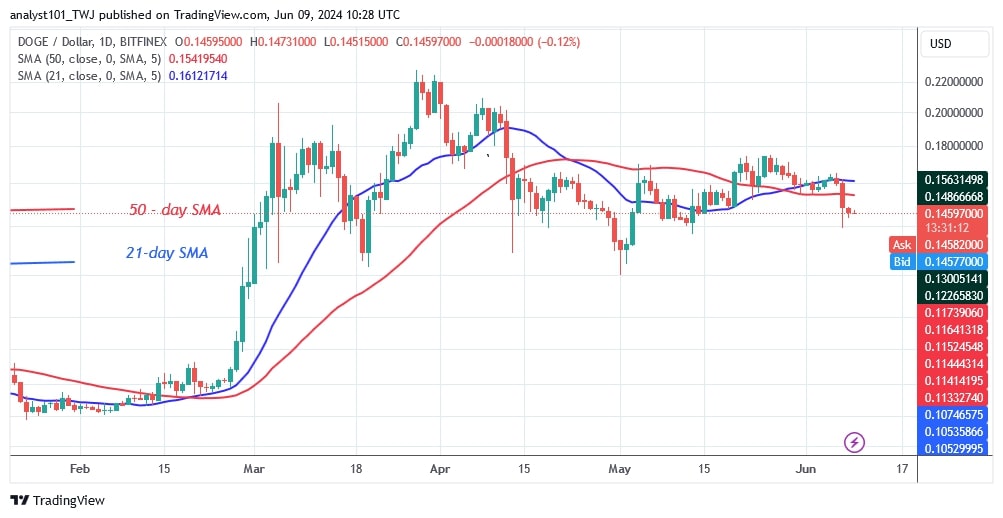
The price of Dogecoin (DOGE) has fallen below the moving average lines, previously trapped between the moving average lines.
Long-term forecast for the Dogecoin price: bearish
On June 7, the altcoin fell to a low of $0.139 before recovering.
On the downside, selling pressure will build up to a low of $0.12. DOGE has been trading above the $0.12 support level since March 19 and has recovered from there. However, should the bears break the previous low of $0.12, the market would fall much further to $0.114. At the time of writing, DOGE is trading at $0.146.
Dogecoin indicator reading
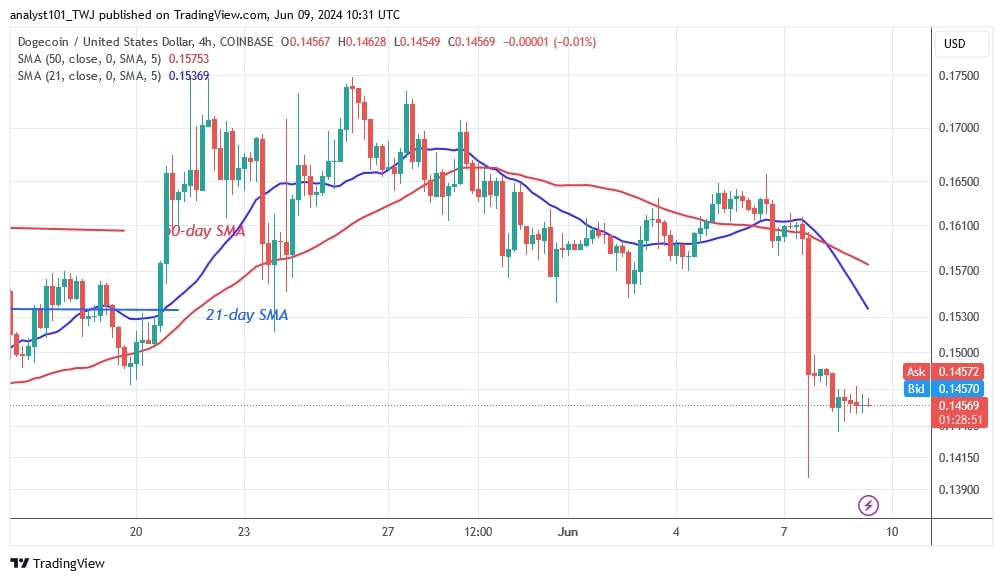
After the price drop on June 7, the price bars are now below the moving average. The 4-hour chart for DOGE shows a bearish crossover. The 21-day SMA has crossed below the 50-day SMA, predicting a further decline in the cryptocurrency.
Technical indicators
Key resistance levels - $0.22 and $0.24
Key support levels – $0.14 and $0.12

What is the next direction for Dogecoin?
DOGE is trading below the moving average lines and could fall even lower if it loses its previous low of $0.12. On the 4-hour chart, the decline has slowed above the $0.148 support. DOGE has been consolidating above its current support over the last 48 hours. Dojis are small, uncertain candlesticks. Doji candlesticks indicate that traders have reached a point of hesitation.

Disclaimer. This analysis and forecast are the personal opinions of the author and are not a recommendation to buy or sell cryptocurrency and should not be viewed as an endorsement by CoinIdol.com. Readers should do their research before investing in funds.
News
Price
News
Price
Price

(0 comments)