Bitcoin Remains Stable Above $43,000 Due To Trader Reluctance
Updated: Jan 08, 2024 at 14:36

The price of the largest cryptocurrency has remained unchanged over the last four days since the doji candlesticks first appeared. BTC price analysis by Coinidol.com.
Bitcoin price long-term forecast: bullish
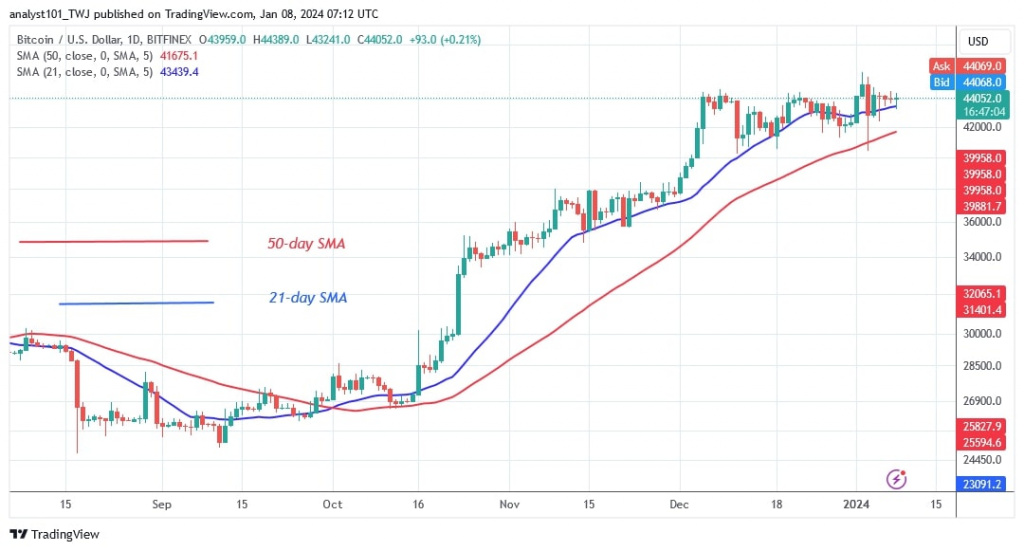
Bitcoin (BTC) price has recovered back above the 21-day SMA or $43,000 support after a price dip on January 3. Bitcoin dropped by $40,383 on January 3 as a result of the market decline.
However, the bulls bought the dips and Bitcoin shot to a high of $44,810 on January 4.
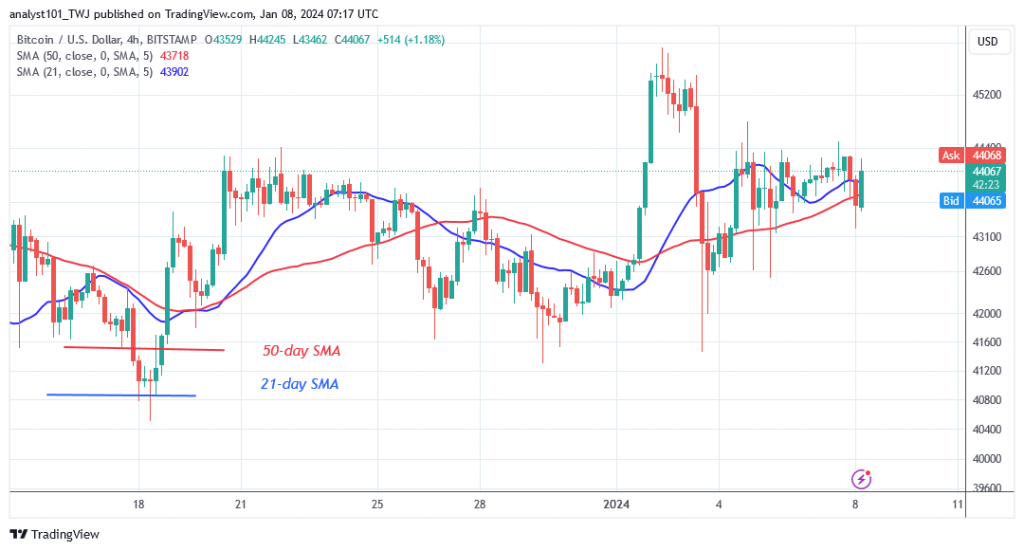
Bitcoin's current price stands at $43,911 as we write this article. Bitcoin price is currently forming doji candlesticks above the 21-day SMA. It is likely that the price will remain above the 21-day simple moving average. Doji candlesticks show that both buyers and sellers are undecided about the direction of the market.
Bitcoin indicator reading
After the rebound on January 4, the price bars are back above the 21-day SMA. The 21-day SMA provides support for the cryptocurrency's uptrend. On the 4-hour chart, the moving average lines have been sloping horizontally since the suspension of the uptrend. The presence of doji candlesticks controls the direction of the price movement.
Technical indicators:
Key resistance levels – $35,000 and $40,000
Key support levels – $30,000 and $25,000

What is the next direction for BTC/USD?
Bitcoin is consolidating above the 21-day SMA or $43,000 support due to the presence of doji candlesticks. The doji candlesticks have limited the cryptocurrency's ability to move either up or down. The price of the largest cryptocurrency is currently fluctuating between $43,400 and $44,400.

On January 4, 2024, Coinidol.com reported that the largest cryptocurrency broke above the $45,920 mark, but was unable to maintain its high pace.
Disclaimer. This analysis and forecast are the personal opinions of the author and are not a recommendation to buy or sell cryptocurrency and should not be viewed as an endorsement by CoinIdol.com. Readers should do the research before investing in funds.
Coin expert
Price
Price
Price
News

(0 comments)