Bitcoin Relatively Stable Above $45,000, Target is the High at $52,000

Bitcoin (BTC) price has been consolidating above the $45,000 support level for the last four days. The largest cryptocurrency is now above the $45,400 breakout level.
Bitcoin (BTC) Price Long-Term Forecast: Bullish
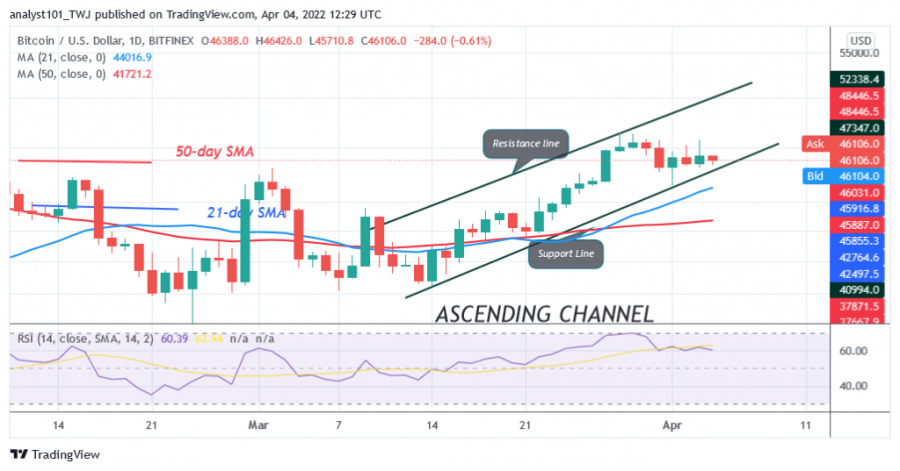
Bitcoin has held relatively steady above current support as buyers struggle to break through initial resistance at $47,600. On April 3, BTC/USD was pushed back at resistance at $47,600 as bitcoin re-entered a trading range. Since March 31, Bitcoin has fluctuated between $45,400 and $48,192, making it difficult for buyers to break into the high at $47,600.
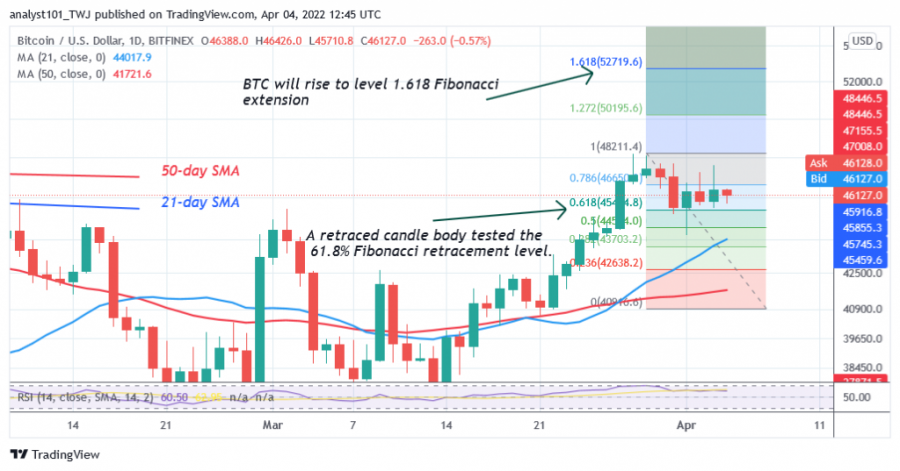
Today, the BTC price is trading at $46,131 as of press time. On the upside, a rise above the current support will push the BTC price above the resistance zones at $47,600 and $48,000. The market will rally above $52,000 if the current resistance is broken. Conversely, the BTC price is fluctuating and if the bears break below the support at $45,400, the downtrend will resume. The market will fall to the low of $40,544.
Bitcoin (BTC) Indicator Reading Bitcoin has fallen to level 60 of the Relative Strength Index for the period 14. Despite the retracement, the largest cryptocurrency is in the uptrend zone and is capable of further upward movement. Bitcoin has a bullish crossover. That is, the 21-day line SMA crosses above the 50-day line SMA, signalling a buy order. The moving averages are sloping upward, indicating an uptrend.

Technical Indicators:
Key resistance levels - $65,000 and $70,000
Key support levels - $60,000 and $55,000
What does the next direction look like for BTC/USD?
BTC/USD is preparing for a possible breakout as the cryptocurrency fluctuates in a narrow range. Meanwhile, the March 29 retracement candlestick uptrend has tested the 61.8% Fibonacci retracement level. The retracement suggests that Bitcoin will rise to the 1.618 Fibonacci Extension level or $52,719.60.

Disclaimer. This analysis and forecast are the personal opinions of the author and are not a recommendation to buy or sell cryptocurrency and should not be viewed as an endorsement by CoinIdol. Readers should do their own research before investing funds.
Price
Coin expert
Price
Coin expert
Price

(0 comments)