Bitcoin Faces Further Rejections At $63,000

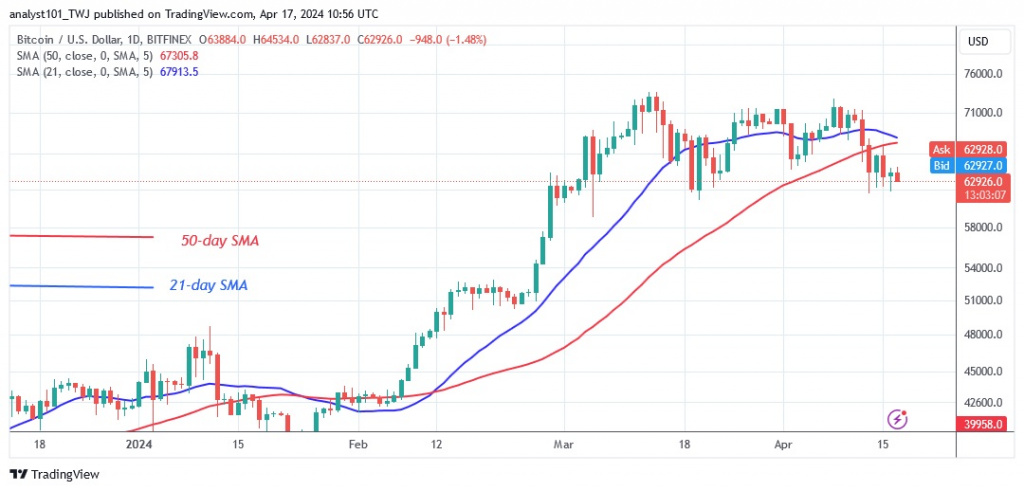
Bitcoin (BTC) price remains below the moving average lines but above the support of $61,000. Cryptocurrency price analysis brought by Coinidol.com.
Bitcoin price long-term forecast: bearish
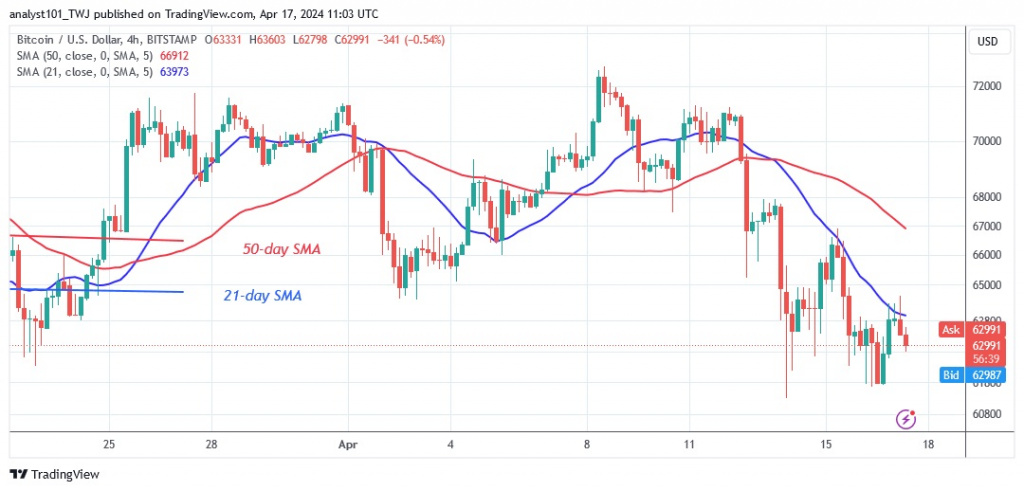
Since the price plunge on April 13, the price has been moving in a narrow range between the low of $60,000 and the resistance at $66,000. Bitcoin is currently worth $63,103. The 50-day SMA or resistance at $66,000 is holding back any further upward movement in the price.
Buyers were rejected on April 14, 2024 when they tried to hold the price above the moving average lines or the $66,000 resistance level. Bitcoin is in a downtrend and is trading modestly within its limited range. On the downside, the existing support of $60,870 has held since March 5, 2024.
Should the bears manage to break the current support level of $60,870, the largest cryptocurrency will plummet to $50,000.
Bitcoin indicator reading
Bitcoin is in a downtrend, with the price bars falling below the moving average lines. The largest cryptocurrency is set for further depreciation as the price bars remain below the moving average lines. On the 4-hour chart, the moving average lines are sloping south, indicating a downturn.

Technical indicators:
Key resistance levels – $70,000 and $80,000
Key support levels – $50,000 and $40,000
What is the next direction for BTC/USD?
Since April 13, 2024, the largest cryptocurrency has fallen and is trading above the psychological price of 60,000 dollars. Bulls and bears continue to fight over prices in a narrow range. On the 4-hour chart, BTC price is facing another rejection of the high at $63,800, albeit fluctuating between $60,000 and $66,000. On the downside, further upside limits will put pressure on the existing support.
As we reported on April 14, the price of the cryptocurrency has been pushed away from the $72,000 barrier zone.

Disclaimer. This analysis and forecast are the personal opinions of the author and are not a recommendation to buy or sell cryptocurrency and should not be viewed as an endorsement by CoinIdol.com. Readers should do their research before investing in funds.
Price
News
Price
Price
Price

(0 comments)