Bitcoin Recovers Above $37,400 and Struggles Below $39,200 High

The price of Bitcoin (BTC) is in a downward correction after the cryptocurrency fell to a low of $37,633.
Bitcoin (BTC) Price Long Term Forecast: Bearish
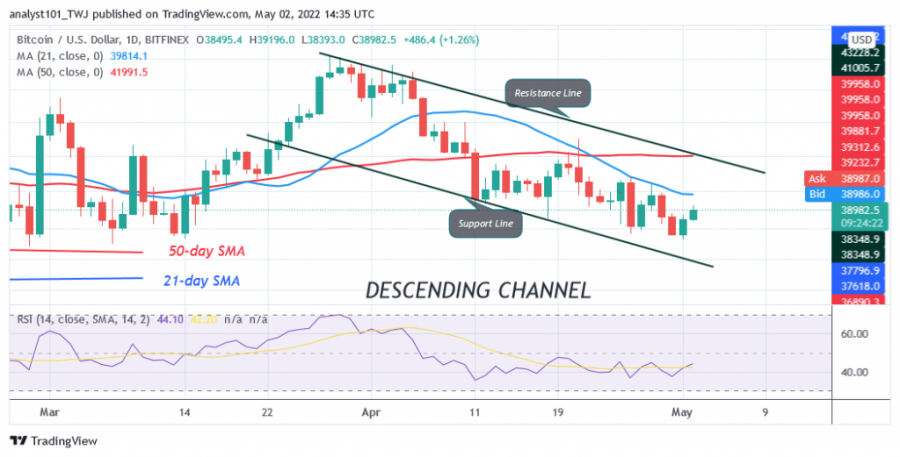
Since April 30, the bitcoin price has held above the $37,633 support level while trending upward again. Currently, the BTC price is retesting the resistance at $39,223 in order to overcome it. The current resistance is the previous support from April 11. If the bulls overcome the current resistance, Bitcoin will be forced to move between $39,223 and $42,000. Today, the largest cryptocurrency is trading at $39,019.90 as of press time. BTC/USD risks another decline if the bulls fail to overcome the resistance at $39,223. The market will continue to fall to the low at $37,050. However, if the bears break below the support at $37,050, the BTC price will fall to $34,425.
Bitcoin (BTC) Indicator Display
Bitcoin is at level 44 of the Relative Strength Index for the period 14. The cryptocurrency is in the downtrend zone and below the midline 50. BTC/USD will continue to fall if it encounters rejection at the 21-day line SMA. On the other hand, if BTC price breaks above the moving averages, it will be a sign of resumption of the uptrend. Bitcoin has a bearish crossover. That is, the 21-day line SMA crosses below the 50-day line SMA, signalling a sell order.

Technical Indicators:
Key resistance levels - $65,000 and $70,000.
Key support levels - $60,000 and $55,000
What is the next direction for BTC/USD?
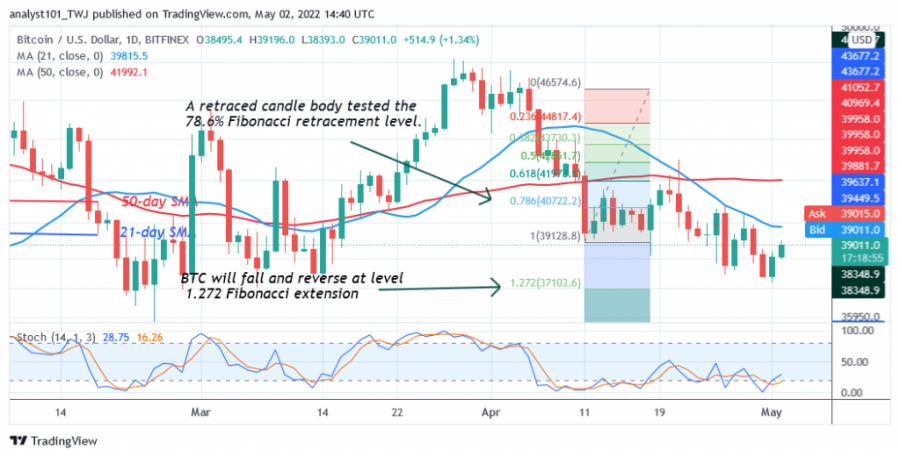
BTC/USD is in a downtrend as the largest cryptocurrency continues to trade in a range. Meanwhile, on April 11, the downtrend tested the 78.6% Fibonacci retracement level. The retracement suggests that BTC will fall, but will reverse at the 1.272 Fibonacci extension level or the $37,103.60 price level.

Disclaimer. This analysis and forecast are the personal opinions of the author and are not a recommendation to buy or sell cryptocurrency and should not be viewed as an endorsement by CoinIdol. Readers should do their own research before investing funds.
Price
Price
News
Price

(0 comments)