Bitcoin Price Stabilizes as Cryptocurrency Market Cap Tops $600 Billion
Updated: Dec 20, 2017 at 15:16

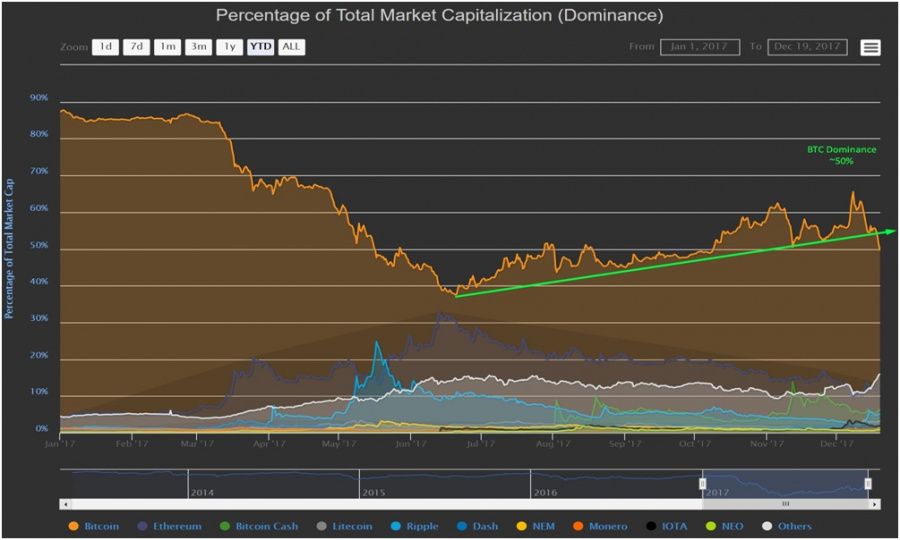
The futures markets are in full swing and price action on the Bitcoin trade has garnered a tremendous amount of activity over the past few weeks. The transaction memory pool has become filled with outstanding transactions to confirm. The average amount of transactions per block is close to an all time high. Bitcoins market dominance has dropped from a recent high on December 7th of 64% to now treading above 50% as the altcoin market has exploded this past week.
Figure 1 shows the current dominance has dropped below a key support line and I see the altcoin market continuing to grow unless Bitcoin explodes.

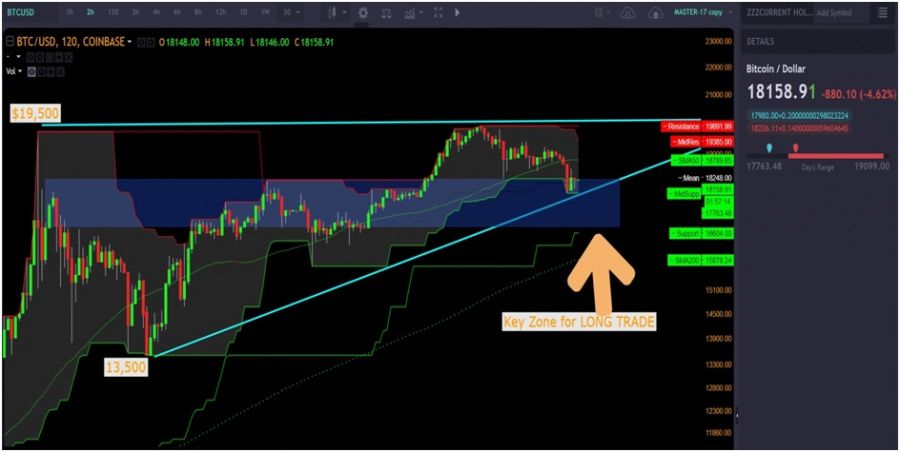
Looking at Bitcoin on a 2hr chart since the futures contracts started as this provides a good measure of price action and volume over the short term. On the chart I make a case for an ascending triangle which is a bullish pattern. On December 16th price tested the $19,000 plus range and took this out to form a double top.
This is a pullback in an uptrend and short term price could settle around the $17,500 range. If it breaks down the possibility to run to the 200 simple moving average would be around $16,000. All in all this is constructive for Bitcoin price and it is still in the bullish phase.
This is also very constructive as volume on the sell off hasn’t been strong enough to warrant a warning. New buyers of Bitcoin and traders need to be conscious that its normal to have a pullback in an uptrend. If it holds the $17,500 we can move sideways and from there price and volume on the next move will show the next short term trend.

About the author

Mark Dukas, Bitcoin and Blockchain Consultant, cryptocurrency trader at BitcoinSmartMoney.com
Price
News
Price
Price
News

(0 comments)